Interactive Lecture Demonstrations
Prediction Sheet—Interference
of Light
Directions: Click here
to download the Prediction Sheet on which you will record your predictions. Write
your name at the top to record your presence and participation in these
demonstrations. For each
demonstration below, write your predictions on this sheet before making any observations.
You may be asked to send this sheet to your instructor.
|
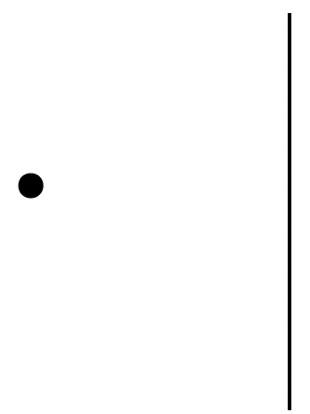
Demonstration 1: A
single point source of light is emitting waves. Sketch your prediction of the
wave fronts of these waves. Describe the intensity of light that reaches the
screen on the right. Only
after you have made your predictions, click here
to open the simulation. Select Waves. When the Waves simulation opens,
click on light source Compare
your observations to your predictions and explain any differences.
|
|
|
|
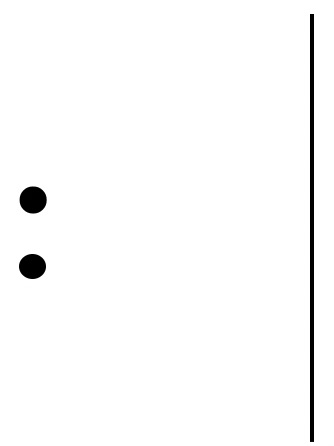
Demonstration 2: Now
there are two point sources of light separated by a small
distance. Both are emitting waves of the same wavelength, and in phase with
each other. Sketch your prediction of the wave fronts of these waves. Show a
wave front from each of the sources when it reaches the screen and describe
the intensity of light on the screen on the right as you move from top to
bottom. Only
after you have made your predictions, open the same simulation as in
Demonstration 1, only this time select Interference. When the
Interference simulation opens, again select light sources and Screen.
Push the buttons on both light sources to start the simulation. Compare
your observations to your predictions and explain any differences. |
|
|
|
Demonstration 3: Suppose you have a meter that measures the electric
field of a light wave as a function of time. You place it in front of the
screen at the center point where the intensity is the brightest, as seen in
Demonstration 2. On the axes, sketch your prediction for the electric field
magnitude as a function of time. Also sketch your prediction if one of the
light sources is turned off. Only
after you have made your predictions, open the same simulation as in
Demonstration 2, again selecting Interference, light sources, and
Screen. Push the buttons on both light sources to start the simulation.
After observing for awhile, move the meter out of
the box at the top, and position one of the detectors just in front of the
center point on the screen. Observe for awhile, and
then turn off one of the light sources, and again observe for awhile. Compare
your observations to your predictions. Explain in terms of the lengths of the
light paths from the two sources to the point on the screen why the intensity
is bright at this spot on the screen when both light sources are on. |
|
|
|
Demonstration 4: Now you place the detector in front of the screen
at a point at the center of a region where the intensity is zero. On the
axes, sketch your prediction for the electric field magnitude as a function
of time. Also sketch your prediction if one of the light sources is turned
off. Only
after you have made your predictions, open the same simulation as in
Demonstration 3. Push the buttons on both light sources to start the
simulation. After observing for awhile position one
of the detectors at a point at the center of a region where the intensity is
zero. Observe for awhile and then turn off one of
the light sources, and again observe for awhile. Compare
your observations to your predictions. Explain in terms of the lengths of the
light paths from the two sources to the point on the screen why the intensity
is zero at this spot on the screen when both light sources are on. |
|
|
|
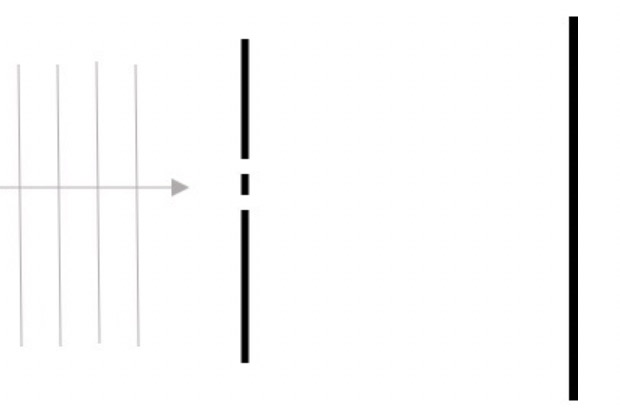
Demonstration
5: A source emits plane waves of
light that are incident on a plate with two closely spaced parallel slits cut
into it, as shown on the right. Predict what you will see on the screen: two
parallel lines, uniform intensity, alternating bright and dark lines,
completely dark screen. In particular, predict the intensity at the center of
the screen, directly opposite the center of the two slits. Only
after you have made your predictions, open the same simulation as in the
previous demonstrations. Select Slits. Then select light source Compare
your observations to your predictions and explain any differences. Compare
these observations to those in Demonstrations 2, 3 and 4. Are the intensity
patterns on the screen similar? |
|
|
|
Demonstration
6: In Demonstration 5, what will
happen to the intensity pattern on the screen if the spacing between the
slits is decreased? What will happen to the intensity pattern on the screen
if the spacing between the slits is increased? Only
after you have made your predictions, in the same simulation as in
Demonstration 5, use the Slit Separation slider to make the separation
half as large. Push the button on the light source and observe. Then, use the
slider to make the separation twice as large as it was at the beginning.
Observe the intensity on the screen. Describe the changes in both cases and
compare to your predictions. Try to explain your observations in terms of the lengths of the light paths from the
two slits to points on the screen. |
||
|
Demonstration
7: In Demonstration 5, what will
happen to the intensity pattern on the screen if the wavelength of the light
is decreased? What will happen to the intensity pattern on the screen if the
wavelength is increased? Only
after you have made your predictions, in the same simulation as in
Demonstration 5, use the Frequency slider to make the light red
(longer wavelength than green). Push the button on the light source and
observe the intensity on the screen. (It will be helpful to note the position
on the screen of one of the bright areas, e.g., the first from the center and
see how it changes,) Then,
use the slider to make the light violet (shorter wavelength than green). Observe
the intensity on the screen. Describe the changes in both cases and compare
to your predictions. Try to explain your observations in terms of the lengths of the light paths from the
two slits to points on the screen. |
||