Interactive Lecture Demonstrations
Prediction Sheet—Kinematics 1—Human Motion
Directions: Click here to download the Prediction Sheet. Write your name at the top to record your presence and participation in these demonstrations. For each demonstration below, write your prediction on this sheet before making any observations. You may be asked to send this sheet to your instructor.
|
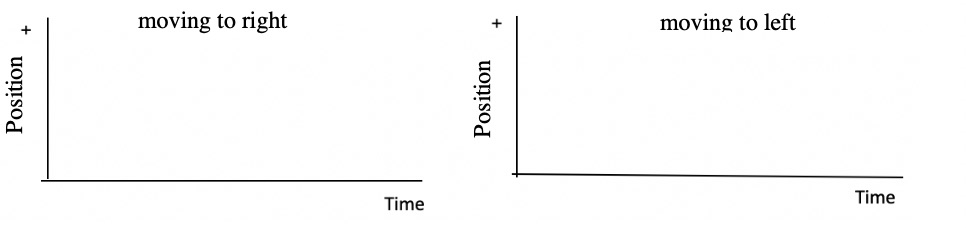
Demonstration 1: The positive direction is toward the right. (A)
Sketch below on the left axes your prediction of the position-time
graph for a person moving to the right at a steady (constant) velocity.
On the right axes sketch your prediction for a person moving to the left at
a steady (constant) velocity. |
|
|
|
|
|
(B) Sketch below on the left axes your
prediction of the velocity-time graph for a person moving to the right
at a steady (constant) velocity. On the right axes sketch your
prediction for a person moving to the left at a steady (constant)
velocity. |
|
|
|
|
|
Only after you have made your predictions, open The Moving Man simulation: https://phet.colorado.edu/sims/cheerpj/moving-man/latest/moving-man.html?simulation=moving-man On the upper
left, select Charts. Remove the Acceleration graph by clicking
on the
1. Compare your observed position-time graphs to your predictions. If they don't agree, explain.
2. On a position-time graph, what tells you if the motion is in the positive or negative direction? Explain.
3. Compare your observed velocity-time graphs to your predictions. If they don't agree, explain.
4.
On a velocity-time graph, what tells you if the motion is in the positive or
negative direction? Explain |
|
|
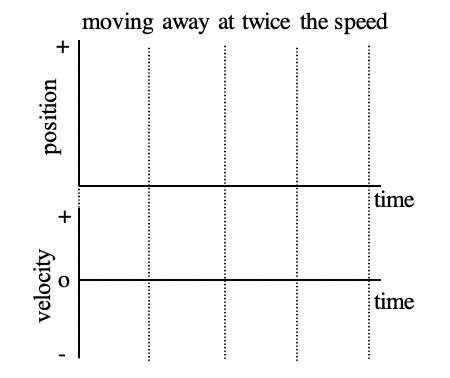
Demonstration 2: The positive direction is toward the right. Sketch on the axes below your predictions for the position-time and velocity-time graphs of a person to the right at approximately three times the speed of Demonstration 1. |
|
|
|
Describe in words your prediction of how the position-time graph changes when the
speed is three times as fast. Describe in words your prediction for how the velocity-time graph changes when the speed is three times as fast. |
|
Only after you have made
your predictions, use The Moving
Man simulation to test them. Click on 1. Compare your observed position-time graphs for the original motion and for moving three times as fast, and also compare to your predictions. What is different?
2. On a position-time graph, what tells you if the motion is fast or slow? Explain.
3. Compare your observed velocity-time graphs for the original motion and for moving three times as fast, and also compare to your predictions. What is different?
4. On a velocity-time graph, what tells you if the motion is fast or slow? Explain.
|
|
|
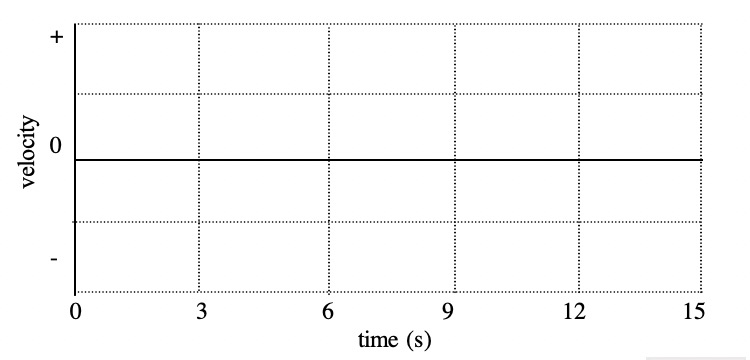
Demonstration
3:
Sketch on the axes below prediction of the velocity-time graph
produced when a person—
• walks in the positive direction slowly and steadily for 6 seconds
• then stands still for 6 seconds
• and then walks in the negative direction steadily about twice as fast as
before
|
|
|
Only after you
have made your predictions use The Moving Man simulation to
test it. Click on Again,
remove the Position and Acceleration graphs by clicking on the Compare
your observed velocity-time graph to your prediction. If they don't agree,
explain why. |
|
|
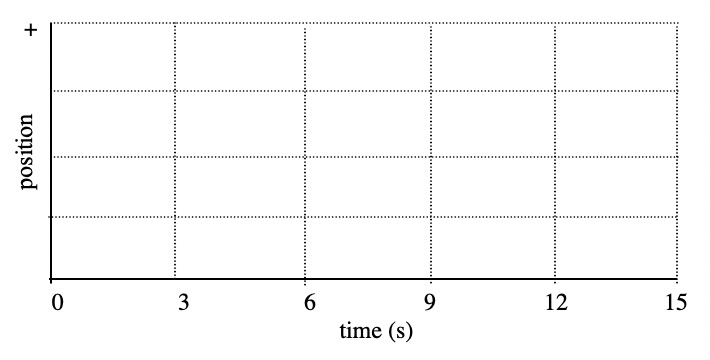
Demonstration 4: Predict the position-time graph for the motion in Demonstration 3 on the axes below. (Align the distance and velocity graphs correctly in time.)
|
|
|
Only
after you have made your predictions return to The Moving Man
simulation to test it. Click on Compare this observed position-time graph to your prediction. If they don't agree, explain why. |
|