Interactive
Lecture Demonstrations
Prediction
Sheet—RC Circuits
Directions: Click here to
download the Prediction Sheet where you will enter your predictions and
answers. Write your name at the top to record your presence and
participation in these demonstrations. For each demonstration
below, write your prediction on this sheet before making any observations. You
may be asked to send this sheet to your instructor.
|
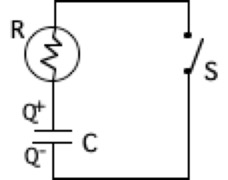
Demonstration 1: The circuit on
the right consists of capacitor C in series with a bulb of resistance R. The
capacitor is initially charged with +Q on the top plate and -Q on the
bottom plate. Predict what will happen to the bulb
after switch S is closed. After
you have made your prediction, download and view the video. Compare to your prediction and explain
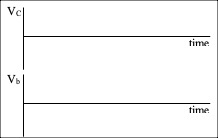
your observation. Sketch on the top axes to the right your
prediction for the voltage across the
capacitor Vc vs. time after the
switch S is closed. Sketch on the bottom axes your prediction for the voltage across the bulb Vb vs. time after the switch S is closed. After
you have made your prediction, download and view the video.
Compare to your prediction and explain your observation. Now
open the RC circuit simulation: https://www.compadre.org/Physlets/circuits/illustration30_6.cfm Select Show graph of voltage vs. time. Note that with
the initial position of the switches, the capacitor has charged through the
bulb, and is initially charged. (When you start graphing, the capacitor
voltage is 1 V and the bulb voltage is 0.) When you click on open/close,
the charged capacitor discharges through the bulb. Observe the voltage graphs
for the capacitor (red) and bulb (green) as the capacitor discharges. Also observe
the bulb (black represents off). Do your observations of the bulb and graphs
agree with the ones you observed above in the video? Explain. |
|
|
What
happens to the charge Q on the capacitor after switch S is closed? Does it increase, decrease, or stay the same? (circle one) Sketch
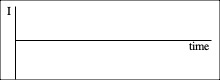
on the axes to the right your prediction for the magnitude of the current , I in the circuit vs. time
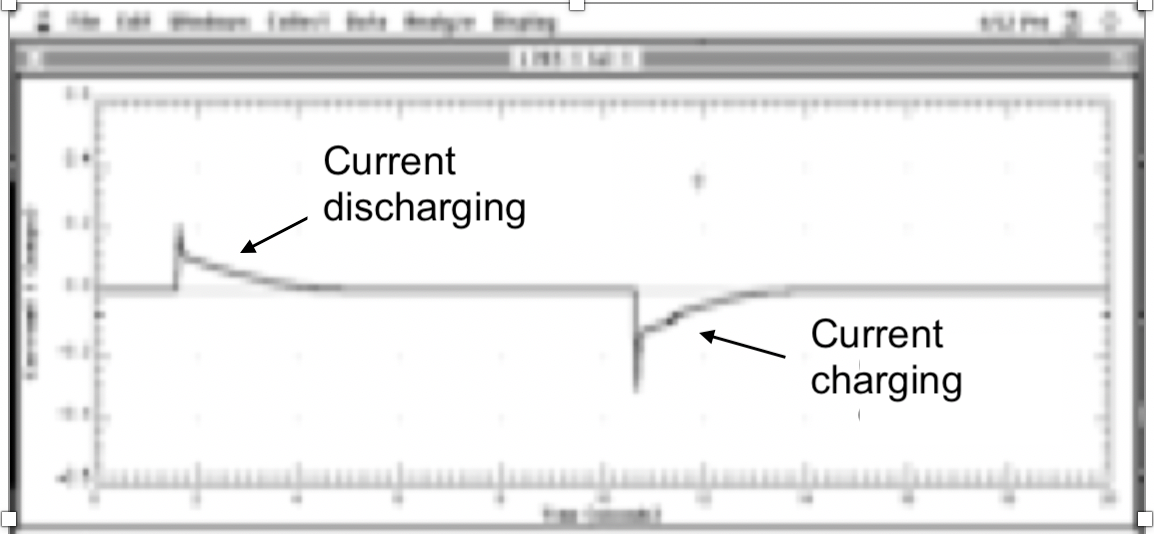
after S is closed. Now
view the graph of current vs. time and compare it
to your prediction. Do these observations agree with your predictions?
Explain. |
|
|
Demonstration 3: The circuit to
the right consists of an uncharged capacitor, a bulb
(resistance R) and a battery of voltage V connected in series. The switch S is initially open. Predict what will happen to the light
bulb after switch S is closed. Also, sketch on
the axes to the right your prediction the voltage
across the capacitor ,Vc vs. time after switch S is closed.
Sketch on the axes to the right the voltage
across the bulb , Vb vs. time after switch S is closed. After
you have made your predictions, open the RC circuit simulation: https://www.compadre.org/Physlets/circuits/illustration30_6.cfm Select
Show graph of voltage vs. time. Begin
graphing, click on open/close as
before, and watch the voltages decay. Then click again on open/close so that the capacitor is now charging
through the bulb. Observe the voltage graphs for the capacitor (red) and bulb (green)
as the capacitor charges. Also observe the bulb (black represents off). Do
your observations of the bulb and graphs agree with your predictions?
Explain. |
|
|
Demonstration
4:
Sketch on the axes to the right your prediction for the magnitude of the current , I in the circuit vs. time
after S is closed. Now
view the graph of current vs. time and compare it
to your prediction. Do these observations agree with your predictions?
Explain. |
|
