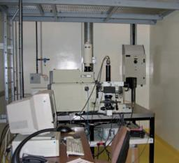
During the last years I acquired expertise on several different tools. Most of them are listed below. The associated pictures are those of the appartus I actually used/use, most of them being either in the Geo fluid laboratory of Helge Gonnermann, at Rice University, Houston, or in the Laboratoire Magmas et Volcans, Clermont-Ferrand, France. I also used many different tools for my samples preparations (e.g., drilling machine, rock saw, polishing machines).
Textural Analyses:
I am conducting textural analyses in order to quantitatively characterize the vesicles and crystals of volcanic samples. Several different apparatus are used to perform this step:
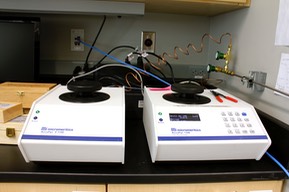
Helium pycnometry: this machine allows us to quantifiy the volumetric fraction of vesicles in a sample. It also permits to distinguish between the closed (isolated) and open (connected) porosities.
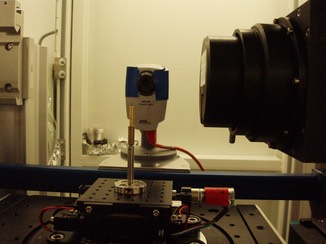
Computed microtomography: CT-scans allow us to determine the 3D network of vesicles and crystals and their spatial relationships, and calculate the vesicle and cystal size distributions and number densities. Different types of microtomographs are used depending on the size of the samples and the spatial resolution one wants to achieve.
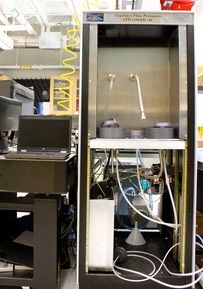
Capillary flow porometer: The goal of this apparatus is to measure the permeability of the sample; i.e., how well gases can pass through the network of connected vesicles or cracks. It can also provide us with an idea of the pore throats size distribution (fluid porosimetry). Permeability is a key physical parameter to constrain in order to understand and model magma degassing during volcanic eruptions.
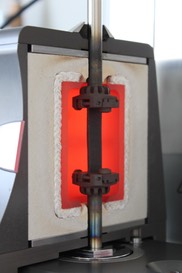
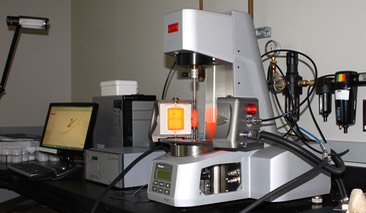
Rheometer (Rice University): this machine allows us to measure the way the magma responds to different applied forces. In order to be able to study volcanic samples, a external furnace is used and rocks can be deformed at temperatures up to 1000°C.
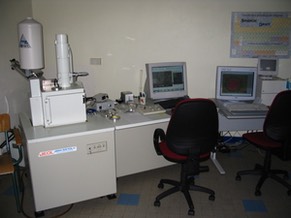
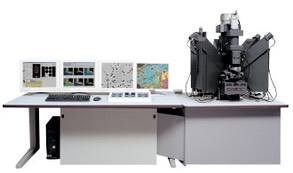
Scanning Electron microscope (SEM): Analyses of SEM images of samples thin sections allowed to calculate vesicles and crystals size and shape distributions. These distributions help in understanding the different phases of degassing during volcanic eruptions.
Chemical analyses:
Chemical analyses of the samples, and especially of the residual matrix glass, give information on the amount of volatiles still dissolved in the magma at the end of an eruption. By difference with the initial amount of volatiles (measured in magmatic inclusions using the same techniques, for example), it allows us to determine the total amount of volatiles emitted during a volcanic eruption.
Electronic microprobe: provides the concentrations of major elements, halogens and sulphur in the glassy groundmass and melt inclusions of samples.
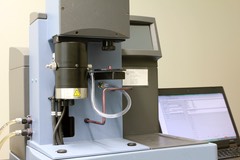
Thermogravimetric analyses (TGA, Rice University): This provides the volatile concentrations of samples (H2O, CO2, SO2, etc.) and the release patterns of volatiles. This apparatus may provide information on speciation and hydration by external water.
Fourier-transform infrared spectroscopy (FTIR) and Raman Spectroscopy: these machines are used to determine H2O and CO2 contents of glassy groundmass of samples.
Numerical modeling:
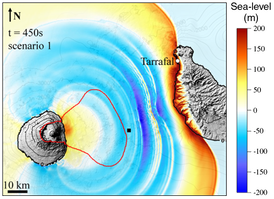
I wrote and write some numerical codes using Matlab for several aspect of my research. I notably used and modified the code VolcFlow, written by Karim Kelfoun to simulate the onset and progatation of volcanic landslides and their associated tsunamis. I also wrote a code of water diffusion in volcanic glass, in 1D, that I used to determine the amount of rehydration a sample can experience.