
ANALYSIS
We hope to prove our hypothesis true through an analysis of the following factors:
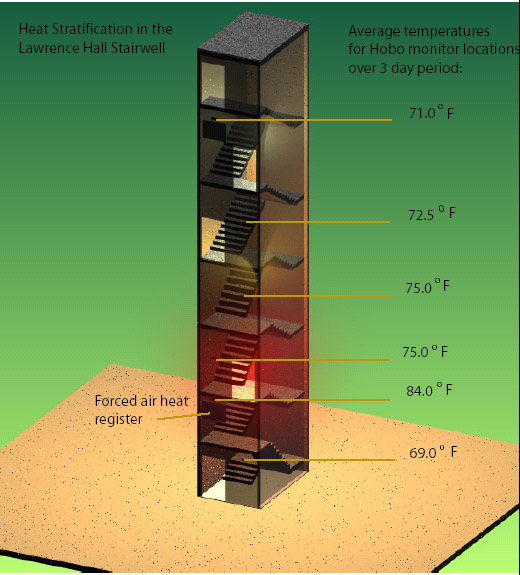
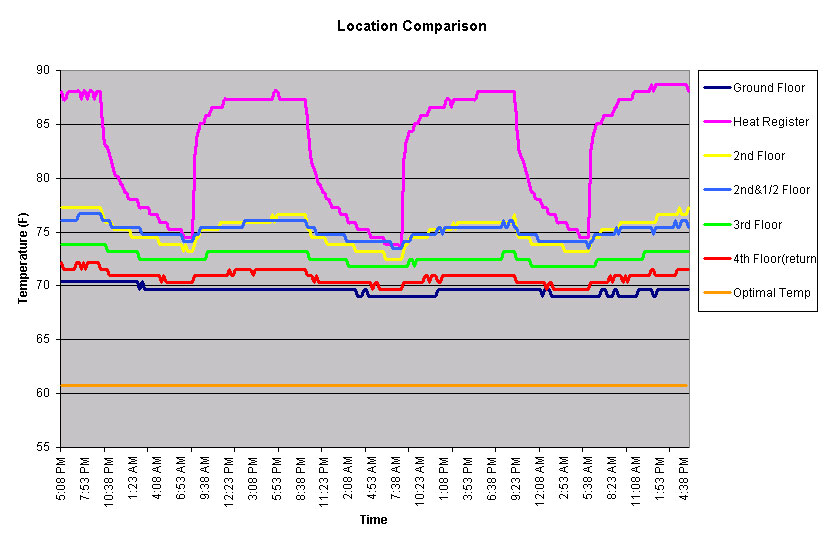
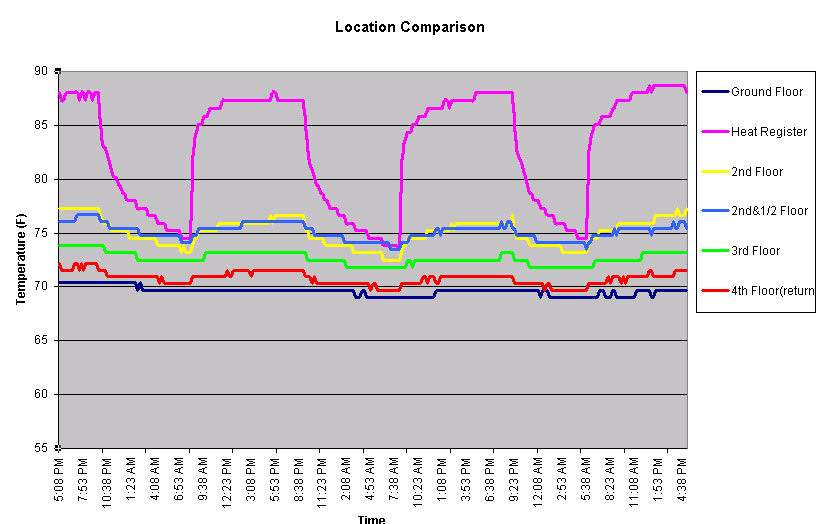
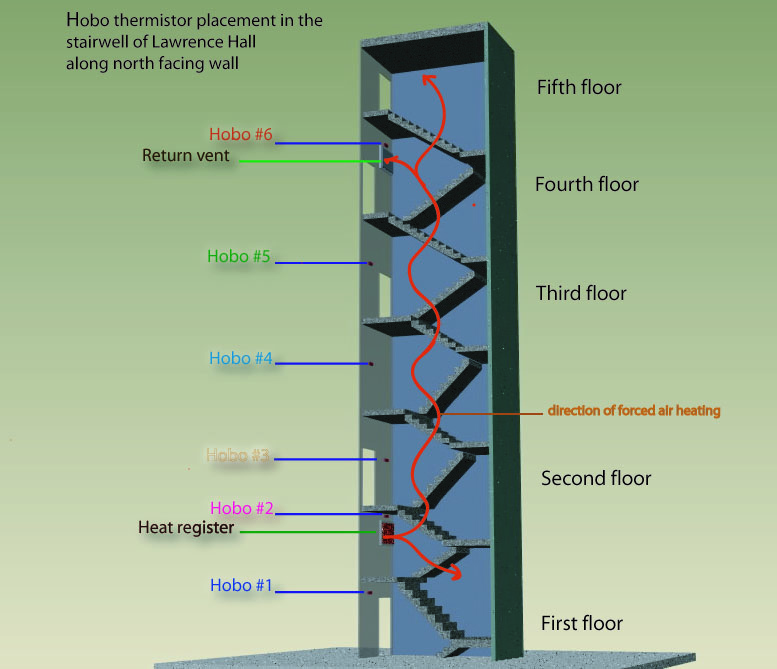
Our data indicates that the temperature is at its coolest (around 70 degrees) below the heating vent on the lowest level, as would be expected. When one approaches the second floor level, though, the temperature rises to around 88 degrees as it is being actively pumped into the space (between the hours of 8 am and 10 pm). When the heating system is not active, this level drops down to around 75 degrees. Further up the stairwell, it can be seen that the temperatures begin to cool and the difference between high and low becomes less dramatic. The third level fluctuates between about 77 and 73 degrees depending upon whether or not the heat is on, while the fourth level only varies between 76 and 74 degrees. At the fifth level, temperature evens out, as there is only a difference of one degree (74 and 73 degrees). At the fourth floor where the exhaust vent is located, the temperature stabilizes around 70 degrees. All of this information can be seen in this heat distribution diagram.
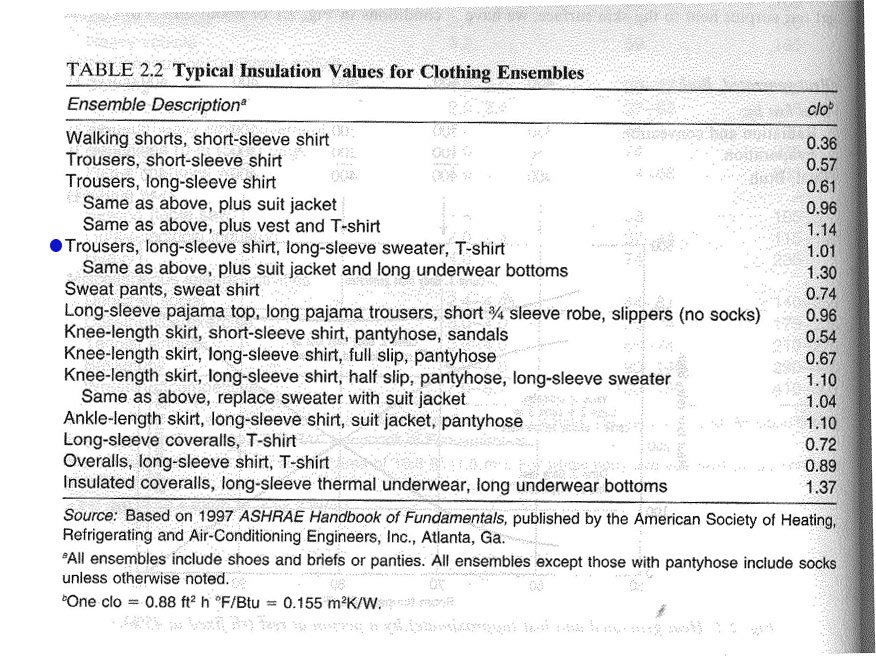
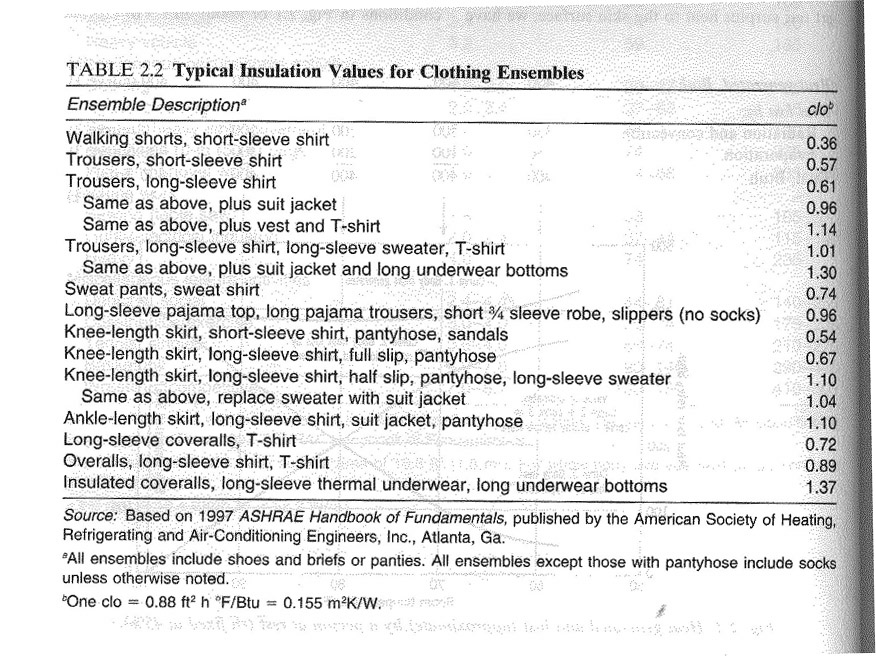
Now that we have determined the temperatures of the stairwell, we must look at the typical clothing level of the average Lawrence Hall occupant. In order to determine this number, we looked at the overall weather conditions in Eugene during the testing period and found the overall average temperature to be 48.5 degrees over the three days. The fact that it was raining all three days must also be taken into account, due to the fact that people typically wear some form of rain gear on these wet days. Given these conditions, we felt a safe estimation of the clothing level to be 1.01- a number that, according to the Typical Insulation Values for Clothing Ensembles chart , correlates to a wardrobe consisting of trousers, a longsleeve shirt, a sweater, and a t-shirt.
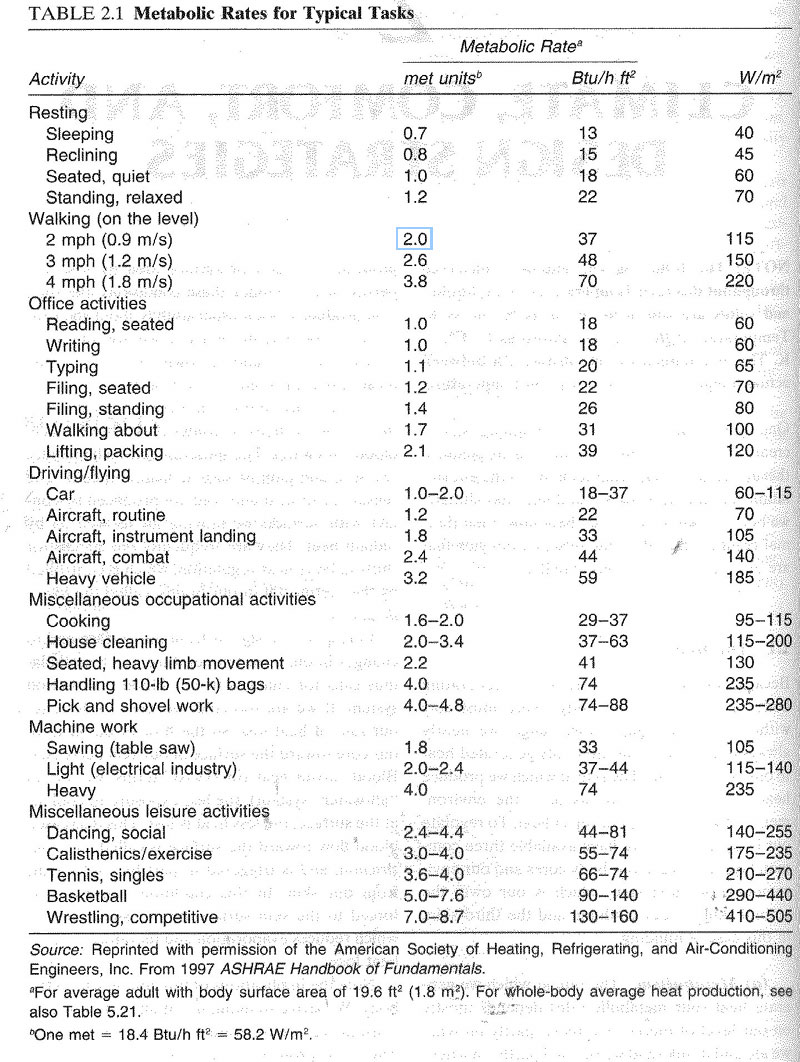
The next step then, was to determine the typical activity level that occurs within the stairwell. For this information, we turned to the Metabolic Rates for Typical Tasks chart , found in the Mechanical and Electrical Equipment for Buildings textbook. Since there is no exact listing for the rate of walking up stairs, for this case study we are going to assume a metabolic rate of 2. This estimation is based upon the fact that walking on a flat surface at 2 mph creates a metabolic rate of 2.0, not taking into account that the individual will be experiencing additional exertion as a result of having to climb up stairs.
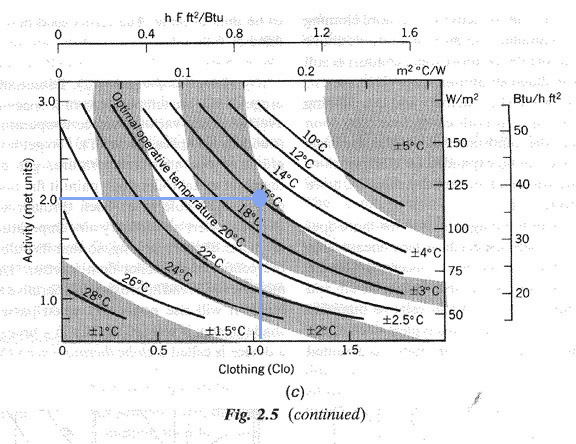
Given a clothing level of 1.01 and a metabolic rate of 2, we can then use these numbers to find the Optimal Operative Temperature using this graph that can be found in the Mechanical and Electrical Equipment for Buildings textbook. According to the graph, the Optimal Operative Temperature for the average individual during the test period is approximately 16 degrees Celcius, or 60.8 degrees Farenheit. Needless to say, this a significantly different temperature than the conditions found within the stairwell, as can be seen in this chart, which compares the stairwell temperatures with the determined comfort level.