
METHODOLOGY
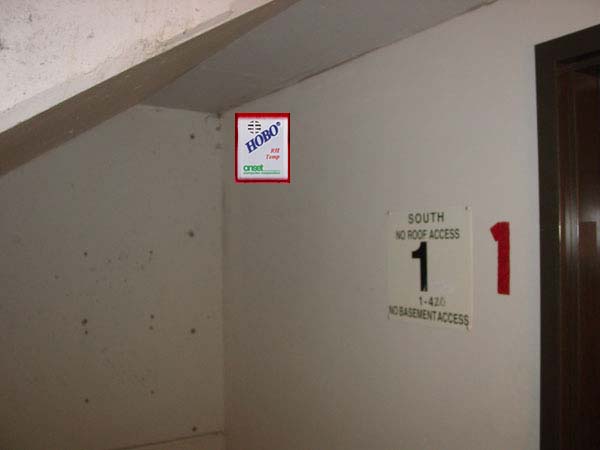
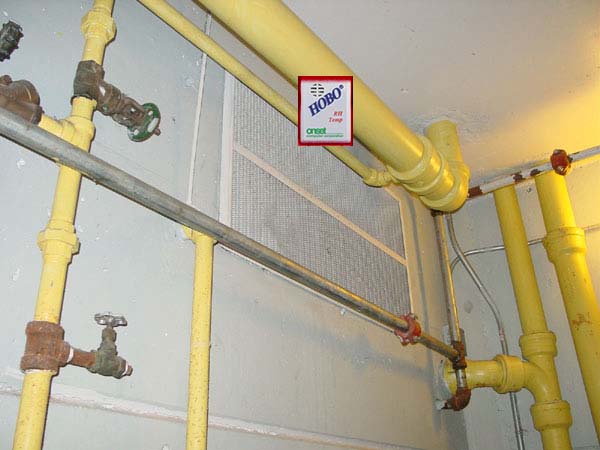
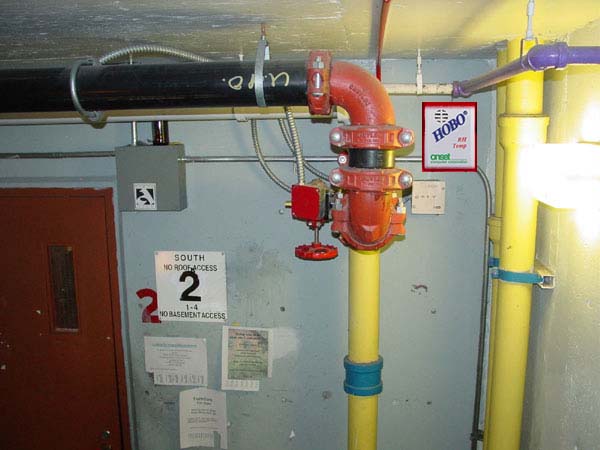
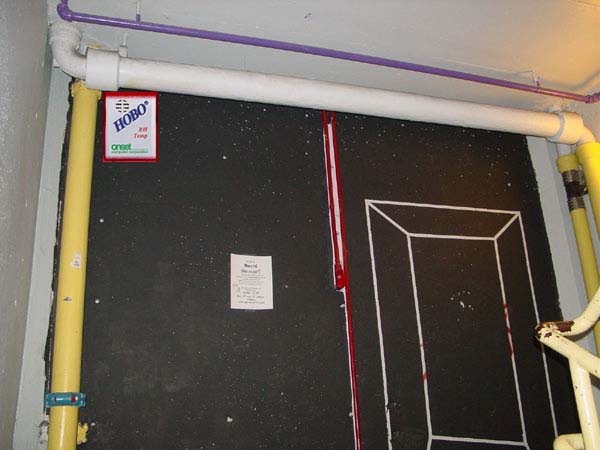
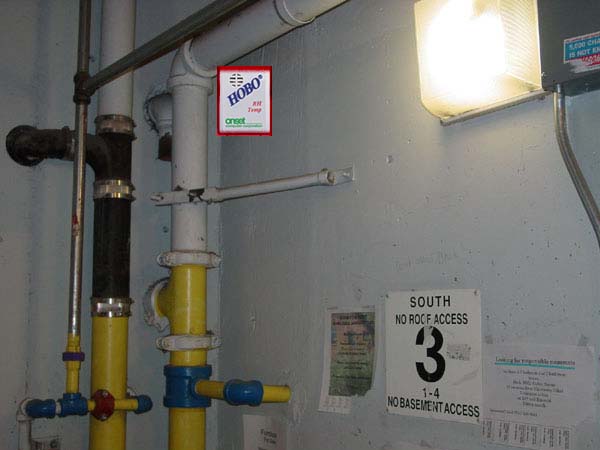
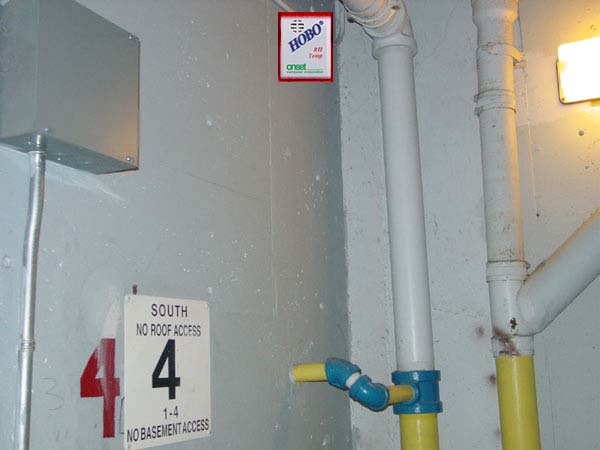
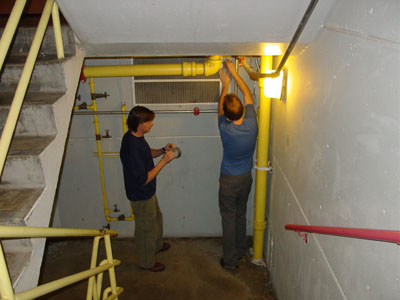
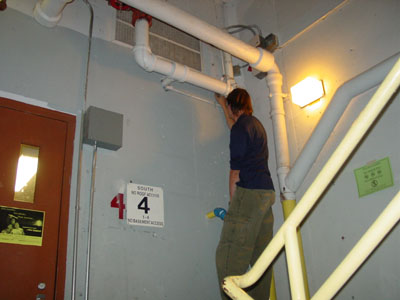
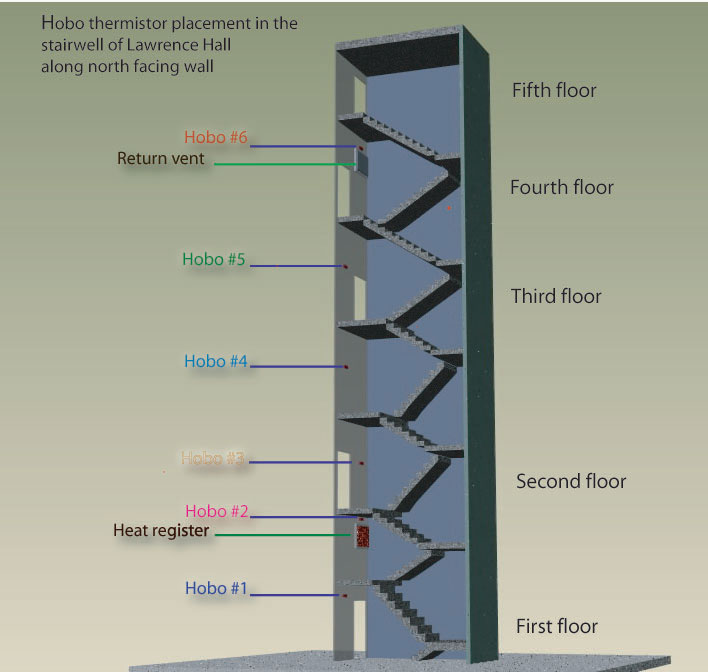
Overview- Our temperature data was collected through the use of six hobos placed on the north wall of each level of the stairwell (Photo A), including one next to the heating vent on the second story (Photo B) and next to the exhausting vent on the top level (Photo C). The exact locations of each hobo can be seen in this placement diagram and in the photos located at the bottom of the page.
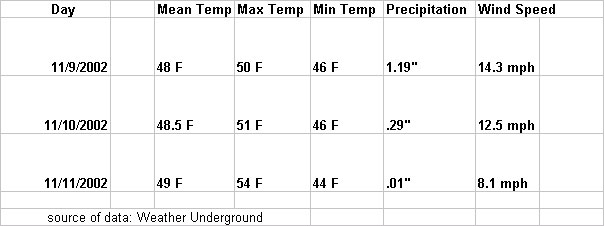
From these data we got an overview of the temperature of this space over the course of three days. We also obtained the outside temperature conditions for these same dates. We used these outside temperatures to estimate the constant clothing level of the users for this three day period. We then used activity, clothing, and temperature data to determine whether or not the stairwell meets thermal comfort levels. All of this we be explained in depth in the Analysis.
The instrument that was primarily used in this study was a Hobo.