Survey
Surveys were distributed to all 272 apartments of Spencerview. Of these 26% (71) were returned to us.
- 45% (32) of the responses were returned from those living in upper units.
55% (39) of the responses were returned from those living in lower units.
Of the three 3-story buildings only one middle apartment returned a pair of surveys for their upstairs and downstairs neighbors. (The generally poor response from the 3 story units can be attributed to the absence of "mail clips" that we asked people to return the surveys to. We were unaware of this when writing the cover letter.)
We classified the survey data by the type of sound transmission it represented (see table below). This allows us to weigh the varying degrees to which different types of sounds were heard, and by whom.
| Airborne |
Impact
|
|
- People talking
- Babies crying
- Radio/ music
- Television
- Alarm clock
|
- Footsteps
- Doors shutting
- Aerobics/Dancing
- Things falling on Floor
- Furniture moving
|
- Toilet flushing
- Water running
|
-
-
-

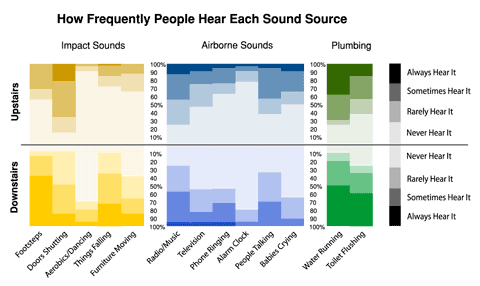
This graph is a "meta-chart" that summarizes how often people upstairs and downstairs heard each sound source, and also allows a preliminary view at larger patterns between airborne, impact, and plumbing sounds.
How to read this graph: each column is a sound source. The responses are shown as percentages of people that responded "Never hear this sound," "Rarely...," "Sometimes," and "Always." The data for people living upstairs reads from the 0% line upwards; for people downstairs, it reads from 0% down. So for instance, in the second column, people upstairs stated that they heard Doors Shutting "Never" a very small percentage (about 15% -- the height of the lightest column above the 0% line). "Rarely"--the next darkest rectangle--also about 15% of respondents. "Sometimes" about 50%, and "Always" 20%.
Calculations
We obtained information about the components of the existing floor assembly by researching the construction documents at the Facilities Office on the University of Oregon campus. We found that the floor used no extravagant measures to limit acoustic transmission. It relies on resilient underlayment, fiberglass batts, and resilient channels for the gypsum board. The calculations below are a near approximation of the existing floor assembly furnished by an acoustical consultant. The resulting numbers for STC and IIC ratings of the floor show that the floor assembly is at or near the values specified by code
|
Laboratory Ratings For Existing Floor Assemblies
|
|
|
|
Vinyl Flooring |
Carpeted |
|
|
|
Finish Floor
|
1/16" Vinyl
|
44 oz. Grospoint carpet and 40 oz. hair pad
|
|
|
|
Decking
|
19/32" T&G Sturd-I-Floor on 2x joists at 16" o.c.
|
19/32" T&G Sturd-I-Floor on 2x joists at 16" o.c.
|
Minimum Value allowed by Code (UBC 1994)
|
|
|
Insulation
|
3" glass fiber
|
3" glass fiber
|
|
|
Gypsum board
|
5/8" screwed to resilient channels
|
5/8" screwed to resilient channels
|
|
|
|
|
|
|
STC (Sound Transmission Class)
|
48
|
45
|
50
|
|
|
IIC (Impact Isolation Class)
|
48
|
69
|
50
|
|
|
|
|
|
|
Reference: Sean Connolly, PE, Big Sky Acoustics
|
|
|
|