We're biophysicists, exploring living systems in which the physical interactions between cellular components can give rise to dynamic structures and patterns. Most of our work examines bacterial communities, especially gut microbes, which we explore by developing and implementing new optical and computational tools. (We used to study membrane biophysics as well; see here.)
Some glimpses of our research projects are given below.
First, an image:
Video: Light sheet fluorescence microscopy of immune cells (magenta) and cells expressing a reporter of immune stimulation (cyan) in a larval zebrafish. The cells are dynamic, searching for and responding to bacteria-induced tissue damage. See if you can identify the tube-like gut, and the beautiful rosettes surrounding the sensory organs that line the body. Scale bar: 50 microns (0.05 mm). From this paper.
How do cells organize themselves into complex tissues and organs in a developing animal? How are geometry, mechanics, and signaling connected to give rise to robust, functional forms? Most of of our work on this theme focuses on the gut microbiome. You, like all animals, are not a single species. Each of us is host to tens of trillions of microbes, mostly resident in the intestines, whose profound importance to health, disease, and development is just beginning to be understood. (See here for a popular article on this.) Conventional methods, based mainly on DNA sequencing, yield important information about the compositions of these commensal microbial communities (i.e. what species are present), but provide little or no insight into their structure and dynamics -- things that must be important for the functioning of a multispecies ecosystem. How do bacterial colonies nucleate and grow? (Can we apply to them our understanding of growth modes of snowflakes, soot particles, and other non-living systems?) How (and why) do bacteria swim in a complex environment? How do different groups compete? What does "equilibrium" look like in a complex system of active, strongly interacting agents?
Our approach to these questions involves directly visualizing gut microbial communities in living organisms. For this we need new sorts of microscopes for three-dimensional imaging, and a good model system to look at.
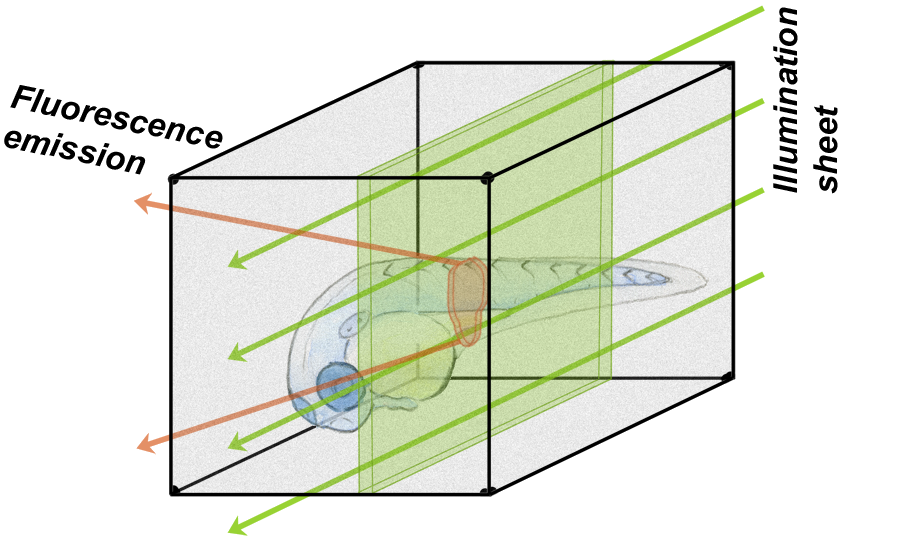
For the former, we make use of light sheet fluorescence microscopy, a remarkable technique in which shaping fluorescence excitation light into a thin sheet allows rapid three-dimensional imaging with low phototoxicity. We build our own light sheet microscopes, which allows tailoring our tools to fit our scientific aims. For a model system we make use of zebrafish, a popular organism that can be raised initially "germ-free" (i.e. devoid of microbes), and then introduced to particular, controlled, sets of microbial species. To read more...
Video: Light sheet fluorescence microscopy of Vibrio bacteria expressing green fluorescent protein, swimming in the intestine of a larval zebrafish. Our lab uses imaging-based approaches to study the gut microbiome, examining bacterial colonization, growth, and interactions.
Scale bar: 50 microns (0.05 mm); Time: real time
Our work on microbial communities intersects that of several groups at the University of Oregon, all interested in the issue of host-microbe interactions.
To explore the above-mentioned topics, we use and also develop a variety of advanced optical microscopy techniques. These include light sheet microscopy, interferometry, and particle tracking.
For a description of some of the computational challenges associated with our bacterial imaging projects, see here. and here.
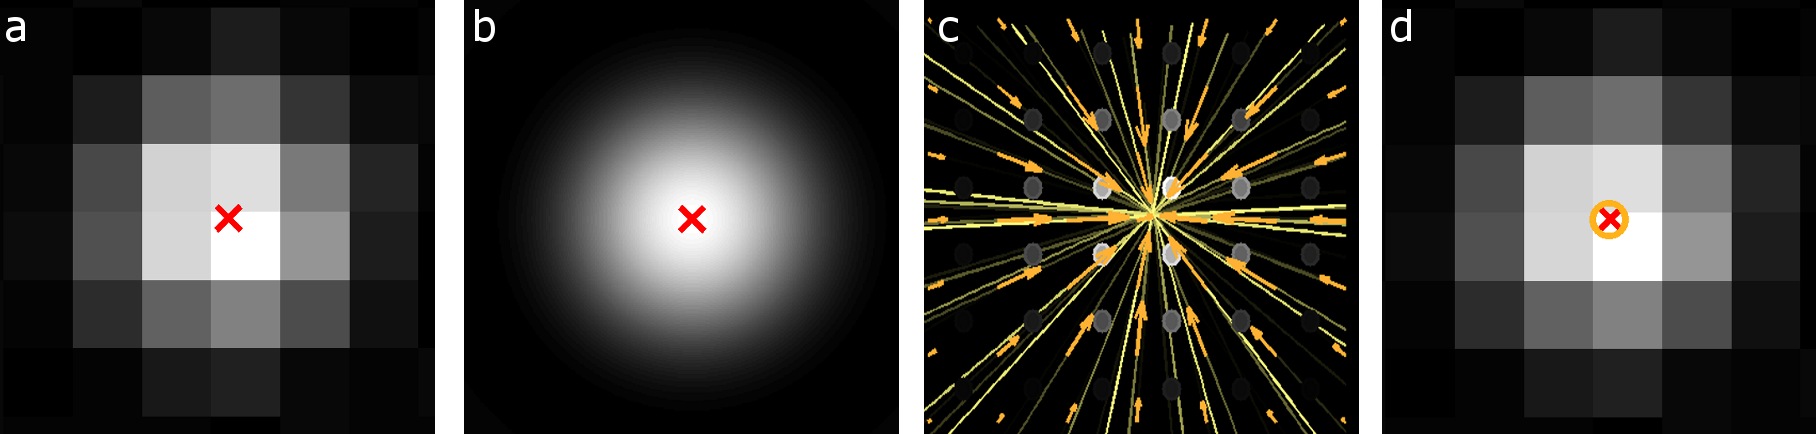
Several years ago, we invented a new, fast, accurate, particle tracking method based on analytic determination of the radial-symmetry-center of a particle image. Please see our Particle Tracking page for the citation, software, and more.
We gratefully acknowledge support from the National Science Foundation, the National Institutes of Health, the Research Corporation for Science Advancement, the Gordon and Betty Moore Foundation, the Simons Foundation, and the Kavli Foundation.