OverviewSolid analytical skills are essential for any policy analyst or public administrator. "Data" allow the analyst to draw conclusions which lead, in theory, to rational policy decisions. However, acquiring data is not enough—analysts must determine what conclusions are justified based on the data. This process of "data analysis" can occur in many ways. Computers and specialized software provide analysts with extremely powerful tools to conduct such analyses. Although computers cannot (and should not) interpret data and draw conclusions, they do allow the analyst to use increasingly sophisticated statistical techniques to assist in policy decisions.SPSS (Statistical Package for the Social Sciences) is a statistical analysis software program. This session is designed to introduce students to SPSS for Windows, a statistical analysis software package.
Objectives
The primary objective of the next three class session is to learn basic data analysis with SPSS. You’ll learn how to enter data, define variables, and perform variable manipulation and transformation. After creating the data set, you will learn how to use SPSS to analyze your data.
Specifically, the objectives of this class are to learn:
- SPSS file types;
- Survey coding and data entry;
- Selected SPSS procedures; and
- Data analysis and interpretation with SPSS.
The SPSS Model
SPSS has similarities to both spreadsheet applications and databases. SPSS requires you to create a database, and then perform statistical manipulations with the data. The key difference between SPSS and these other applications, is SPSS is designed for statistical analysis. Thus, it has far better and more efficient statistical capabilities than most spreadsheet and database applications.
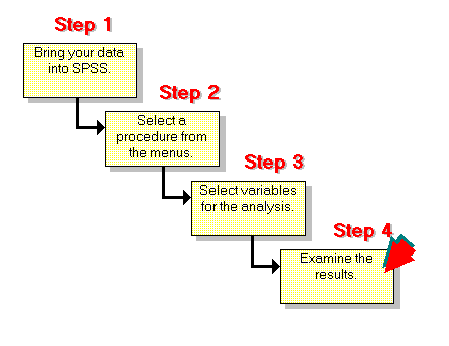
Analyzing data with SPSS is relatively easy. You'll need to complete several steps to perform your analysis:
- Get your data into SPSS.You can open a previously saved SPSS data file; read a spreadsheet, dBASE, or text data file; or enter your data directly in the Data Editor.
- Select a procedure from the menus to calculate statistics or create a chart.You can select a procedure to perform statistical analysis or select a procedure to create high-resolution charts.
- Select the variables you want to use in the analysis.The variables in the data file are displayed in a dialog box for the procedure.
- Run the procedure and look at the results.
It is difficult to adequately describe how SPSS works without the benefit of the software. Thus, we are meeting in the SSIL lab for the SPSS sessions.
We worked through SPSS Exercise 1 in class.
[Home | Syllabus | Schedule | Assignments | Project | Links]
This page maintained by Bob Parker, ©2002
September 26, 2000
