 |
|
|
|
 |
|
|
|
|
|
| Data & Analysis |
|
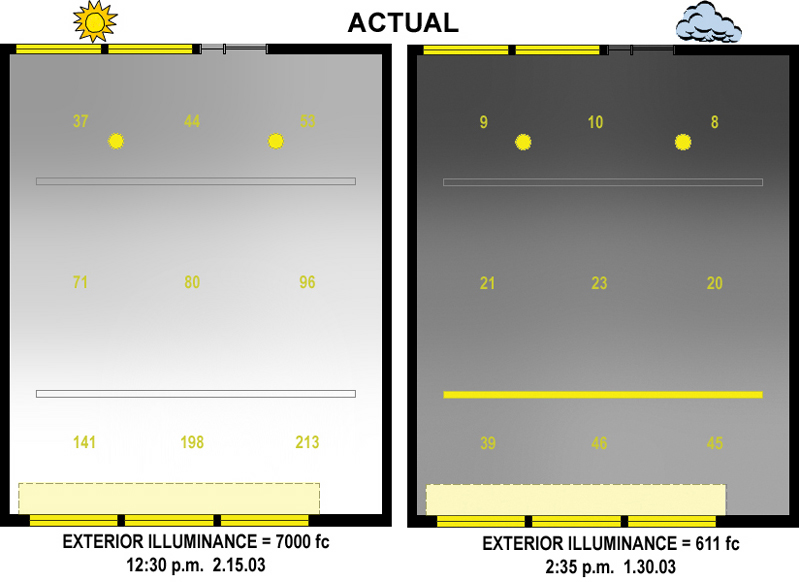
The desk height illumination graphs exhibit approximate illumination values at desk height in one classroom at Ash Creek Intermediate School. The numerical values presented correspond to nine uniform data points where measurements were taken during each test. The unit of measurement employed is the footcandle (fc). The gradient effect evident in each graph was generated by first creating a grayscale corresponding to the general range of data taken (from 0-125 fc; measurements above 125 fc appear in white), next creating uniformly sized planes corresponding to each data point and rendering them in the appropriate shade, and finally, applying a "gaussian blur" filter in Adobe Photoshop to a radius of 40 pixels. This filter calculates for each pixel the mean hue of all pixels within a 40 pixel radius and renders it thus. This technique only presents an approximation of the actual illumination level gradient and is primarily for visual reference and supplementation of the 'hard' data.
|
|
 |
|
 |
|
 |
|
 |
|
 |
|
 |
|
|
|
|
|
 |
|
 |
|
 |
|
 |
|
|
|
 |
|
|
| These graphs show the data collected for typical conditions on a sunny and a cloudy day. If the room grows dark enough on a cloudy day the lighting controls will turn on the bank of lights closest to the window. Data shows that even with this light on illuminance levels are still considerably lower than those on a sunny day with the light is off. On a sunny day, without any aid from electric lights, the illuminance levels meet the calculated IESNA recommendations for every point in the classroom. For cloudy conditions, however, only the third of the classroom nearest the windows (at the bottom of the diagram) is adequately illuminated |
|
|
 |
|
|
|
|
|
|
|
|
|
|
|
|