Chart of Biography
Introduction
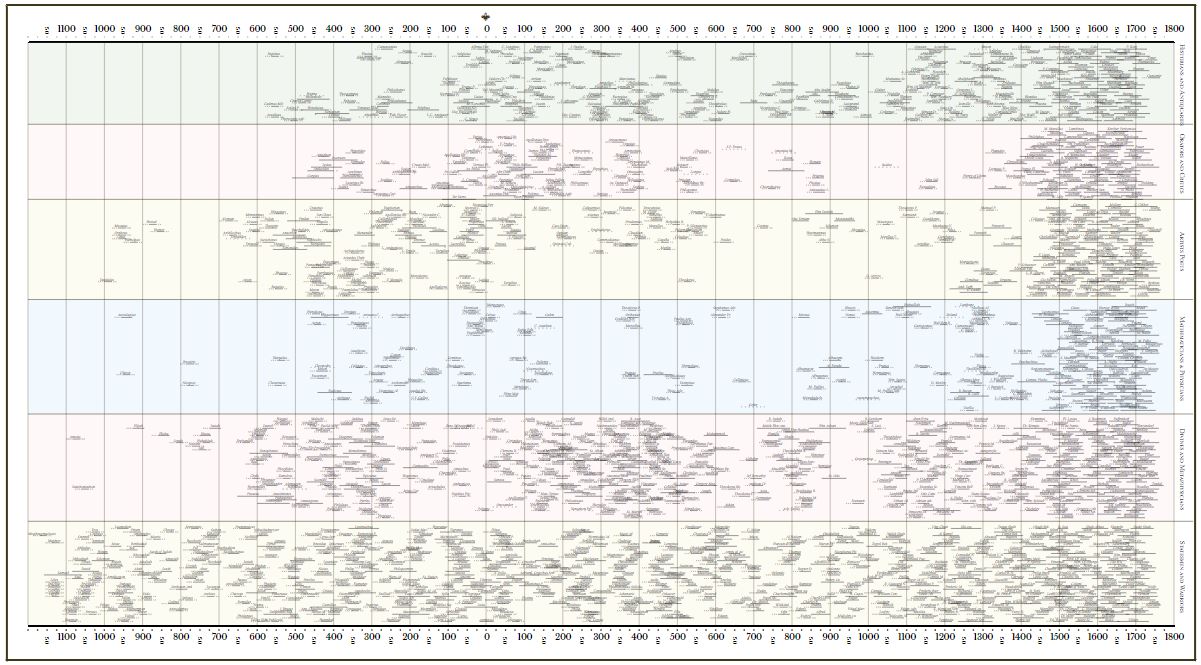
Joseph Priestley's Chart of Biography is simple in design but ambitious in aim. In it, Priestley registers the lives of roughly 2500 important people over three millennia from 1200 BC to his present in 1765 AD. Thin vertical lines on the chart mark centuries. Dots along the scale at top and bottom mark decades. Along the vertical axis, the chart divides into six wide bands representing categories of achievement. Within each row, horizontal lines mark the lengths of individual lives. These are grouped roughly by nationality, tradition, and specific occupation. The Chart of Biography is both a work of reference and a panorama. In its index, you can look up names of historical figures to see when they lived and died. On the chart itself, you can go to a moment of time and area of achievement to see who was important to that field then. The chart can be read horizontally to see which figures followed one another, and it can be read vertically to see whose lives overlapped. The chart also displays patterns: on it, for example, one can see, says Priestley, the emergence of key clusters in philosophy in Classical Greece and in natural science in seventeenth-century Europe. Crucially, one can also see a general acceleration of achievement in recent centuries. The fact that the chart is dense with names at the right side, Priestley argues, is not simply an artifact of the data collection process; it is, he says, a reflection of progress in modern times.
Scroll down to explore how to read the chart.
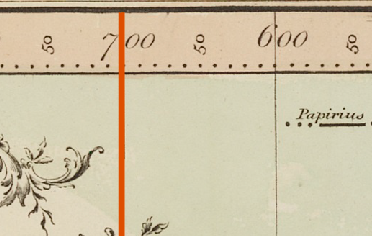
In Priestley's charts, time unfolds horizontally from 1200 BC on the left to 1800 AD on the right. Centuries are indicated by thin vertical lines and decades by dots.
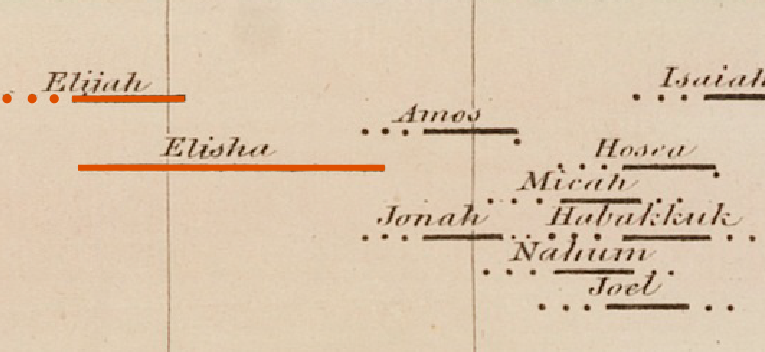
The lives of historical figures are represented by horizontal lines. A solid line depicts certainty in dates, while dots represent varying levels of uncertainty.
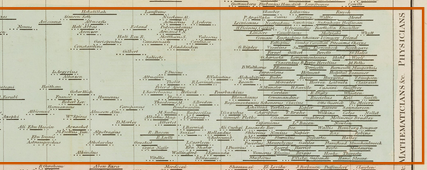
Historical figures are grouped into six areas of achievement: Historians, Antiquaries, and Lawyers; Orators and Critics; Artists and Poets; Mathematicians and Physicians; Divines and Metaphysicians; Statesmen and Warriors.
Following Priestley's procedural process, we created a data driven digital version of the chart, which you can interact within the sections below.
 Death year and life span
  Death year
 Flourished year
 Death year and approx life span
  Approx death year & approx life span
 Birth year and approx death year
 Approx death year
 Approx flourished year