
Data
Classroom 311
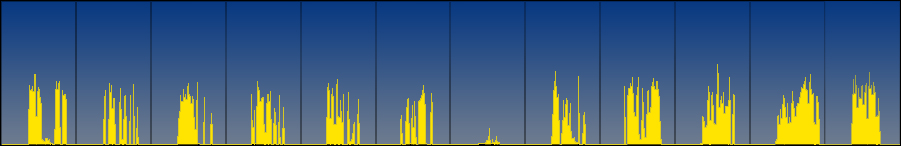
This graph shows the luminous readings for this south facing classroom, taken every 15 minutes during the two week testing period between February 2nd to February 13th.
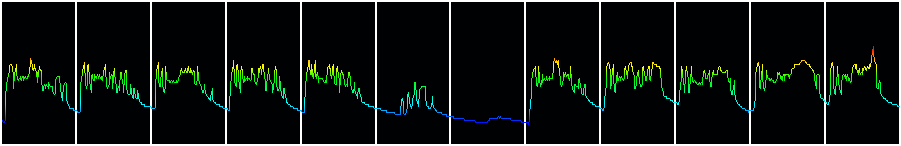
This graph shows the temperature readings for this south facing classroom, taken every 15 minutes during the two week testing period between February 2nd to February 13th.
Classroom 402

This graph shows the luminous readings for this north facing classroom, taken every 15 minutes during the two week testing period between February 2nd to February 13th.
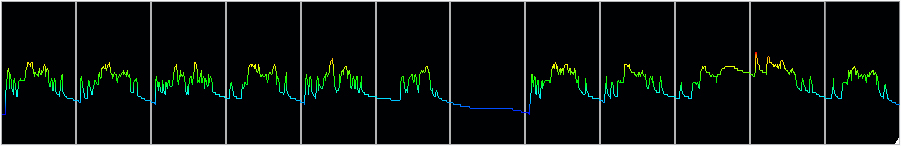
This graph shows the temperature readings for this north facing classroom, taken every 15 minutes during the two week testing period between February 2nd to February 13th.
To view the raw data, see our data file: Excel file (1.72 MB).