Methods
Equipment List
- 8 Binary tracking HOBO Data loggers for collecting ON/OFF light level changes
- 8 Multi-tracking HOBO Data loggers for collecting light levels, relative humidity and temperature data
- Personal computer with Excel Spreadsheet
Classrooms
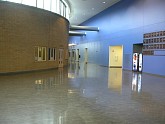
We chose classrooms from the northwest wing of the High School.
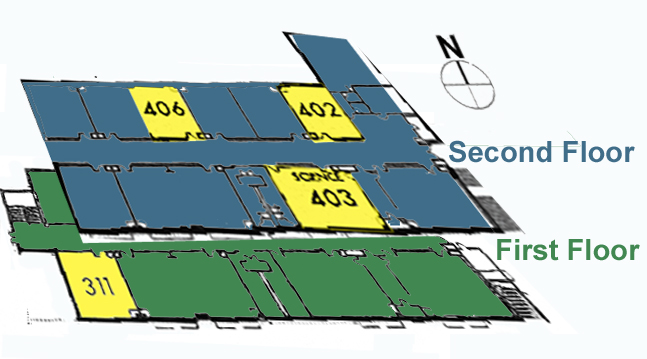
- North facing Classrooms:
406 and 402
- South facing Classrooms:
311 and 403
- South facing Classrooms:
Data Logger Placement
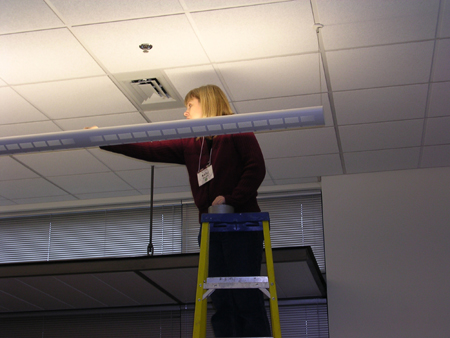
We placed four data loggers in each classroom in the light fixtures between the florescent tubes. There are two fluorescent light fixtures in each room with 5 fluorescent (T5) tubes per fixture.
- Two binary-tracking data collectors were placed in the light fixture closest to the window
- Two multiple-tracking data collectors were placed in the opposite light fixture
Rationale and Process
We chose the two north-facing classrooms and two south-facing classrooms so that we could compare any possible difference between the way the electric lights behaved with access to southern light as opposed to northern light.
The following is a step-by-step outline of our data gathering process.
Step 1: Launching data loggers
We launched the multi-tracking data loggers to collect readings every 15 minutes. Each reading included a light level, relative humidity and temperature. The binary data loggers were set to track changes in lighting from OFF to ON and from ON to OFF.
Step 2: Testing the sensors
We tested the sensitivity of each of the dataloggers by shining various levels of light on the sensors and watching the dataloggers reading real-time on the computer.
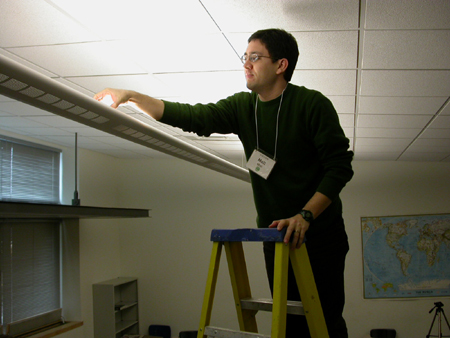
Step 3: Placing the data loggers
We placed the data loggers in each of the light fixtures between the florescent tubes in each of our chosen classrooms.
Step 4: Retrieving the data loggers
After the data loggers had been collecting data for two weeks we removed them from the light fixtures. We then moved the transferred the data from each logger and evaluated the data in Excel.