DATA
HOBO DATA
ANEMOMETER DATA
all units are ft/m
INTRODUCTION
HYPOTHESIS
METHODOLOGY
|
DATA
|
|||||||||||||||||||||||||
|
HOBO DATA
|
|||||||||||||||||||||||||
|
|||||||||||||||||||||||||
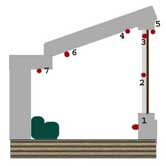
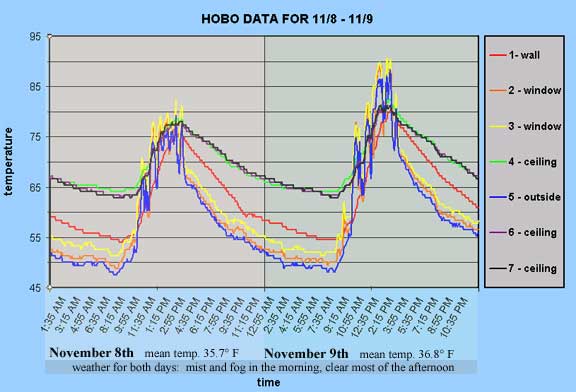
| Temperatures taken at the ceiling remained relatively stable, but temperatures taken at the window fluctuated almost as much as the outdoor temperature. In between was the temperature taken at the wall under the window. We assumed that the spikes in graphs 2,3,and 5 were due to changing amounts of sunlight at these locations, since all three of these HOBOs were in the sun, one outside and two on the window. | |||||||||||||||||||||||||
|
|||||||||||||||||||||||||
|
ANEMOMETER DATA
|
|||||||||||||||||||||||||
|
|||||||||||||||||||||||||
|
all units are ft/m
|
|||||||||||||||||||||||||
| As recorded, there was a lot of air movement by the cracks around the windows, but not much movement where there were no visible cracks. It is clear that heat is being lost through infiltration. | |||||||||||||||||||||||||
| HOME INTRODUCTION HYPOTHESIS METHODOLOGY |
|||||||||||||||||||||||||