METHODOLOGY
APPROACH
Our intent was to measure the dry bulb temperature differences at various points along the section of one bay of the hallway, emphasizing the ceilings and the windows. The temperature loggers at the ceiling show how the temperature changes as the distance from the window and height of the ceiling changes. The temperature loggers on the interior and exterior of the window help determine heat loss through the glass. The anemometer readings tell how much heat is being exchanged through infiltration.
EQUIPMENT USED
• Seven (7) HOBO XT Dataloggers, along with their thermistors each set to record the dry bulb temperature at a 5-minute interval from 7 PM on November 7th until 10 AM on November 10th
&#x One (1) Solomat hot wire anemometer to record air velocity through the cracks in the windows.
HOBO data logger
PLACEMENT OF EQUIPMENT
HOBO XT
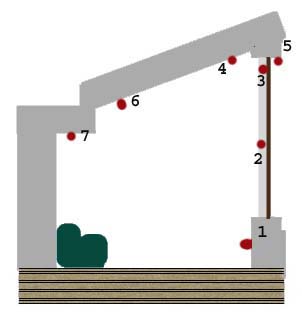
&#x One (1) HOBO was placed on the solid section of the wall, just below the window
&#x Two (2) HOBOs were placed directly on the window, at different elevations, one at midpoint, and one at the top of the window.
&#x One (1) HOBO was placed on the exterior of the window
&#x Three (3) HOBOs were placed on the ceiling in varying locations-
locations of HOBOS in section
Anemometer
The anemometer readings were taken at the visible cracks in the window assembly. Direction and air speed were noted.
next
HOME
INTRODUCTION
HYPOTHESIS
METHODOLOGY
DATA
RESULTS & ANALYSIS
CONCLUSIONS
ACKNOWLEDGEMENTS