 Site Tour
Project Essay
Daniel Rosenberg
Robert D. Clark Honors College
University of Oregon
Joseph Priestley and the Graphic Invention of Modern Time
Labitur et labetur in omne volubilis aevum
In historiography, the idea of time is expressed through a variety of figures, not the least of which is the line. Indeed, in temporal representation in general, the linear metaphor appears virtually everywhere, in texts and images, and in the many different devices used for the reckoning of time. On an analog clock, for example, the hour and minute hands trace lines through space; though these lines are circular, they are lines nonetheless. The same figure is at work even in digital clocks: here, as George Lakoff and Mark Johnson have argued, the idea of time is signified by the "intermediate metaphor" of numbers as points on a line.[1] For W. J. T. Mitchell, the notion that time might be thought apart from the spatial metaphor of the line flies in the face of the cultural evidence. He writes, "The fact is that spatial form is the perceptual basis of our notion of time that we literally cannot 'tell time' without the mediation of space."[2] According to Mitchell, all temporal language is "contaminated" by spatial figures. "We speak of 'long' and 'short' times, of 'intervals' (literally, 'spaces between'), of 'before' and 'after' all implicit metaphors which depend upon a mental picture of time as a linear continuum. . . . Continuity and sequentiality are spatial images based in the schema of the unbroken line or surface; the experience of simultaneity or discontinuity is simply based in different kinds of spatial images from those involved in continuous, sequential experiences of time."[3] For Western thought, it would seem that time is unthinkable apart from the line.
Understood in the broadest sense, this proposition may well be accurate: the history of literature and art furnish an abundant store of examples, and, as in the case of the digital clock, many instances where a metaphor that appears to draw from a different source nonetheless bears within it an implicit linear figure. This is the case in the famous passage from Shakespeare where Macbeth compares time to an experience of language fragmented into meaningless bits. Hillis Miller writes, "For Macbeth, time is a sequence of days that stretches out in a line leading to its cessation at death, figured as a series of syllables making a sentence or strings of sentences, for example a speech by an actor on the stage. Time, for Macbeth, exists only as it is recorded. It is a mad nonsensical tale, an incoherent narrative. Such a narrative is made of pieces that do not hang together, a series of syllables that do not cohere into words and sentences: 'Tomorrow, and tomorrow, and tomorrow/ Creeps in this petty pace from day to day,/ To the last syllable of recorded time.'"[4] According to Miller, the tragedy of Macbeth resolves to that of a character who struggles literally toward the end of his line.
In the graphic arts, the same holds true: from the most ancient images to the most modern, the line appears as a central figure in the representation of time.[5] The linear metaphor is ubiquitous in everyday visual representations of time as well in almanacs, calendars, charts, and graphs of all sorts. Among the most prominent of these are genealogical and evolutionary trees, forms of representing temporal relationships that borrow both the visual and the verbal figure of "lineage."[6] So it comes as something of a surprise to discover that it was only quite recently that scholars first thought to represent chronological relationships among historical events by placing them on a measured timeline. This fact is not only surprising in retrospect: in the 1750s and 60s, when the modern timeline was first introduced, observers found it equally strange. Certainly, there was no technical reason why a regular timeline could not have been introduced earlier. Technologies of printing and engraving had long been available, as had techniques for geometrical plotting and projection far more complex than were necessary for this application.[7]
According to the scientist and theologian, Joseph Priestley, the most prominent eighteenth-century proponent of the timeline, it was remarkable that something so simple and natural should have been until then overlooked. What is more, as soon as Priestley presented an example of such a device, the proportional or "equisecular" representation of chronology became a sensation. Priestley's own Chart of Biography (1765) and New Chart of History (1769) went through many editions (more than twenty, together, the latest appearing in 1820).[8] Priestley's works were immediately praised and widely copied; variations on them can be found in works as different as James Playfair's antiquarian System of Chronology of 1784 and Nicolas Chantreau's theoretical manifesto Science de l'histoire of 1803.[9]
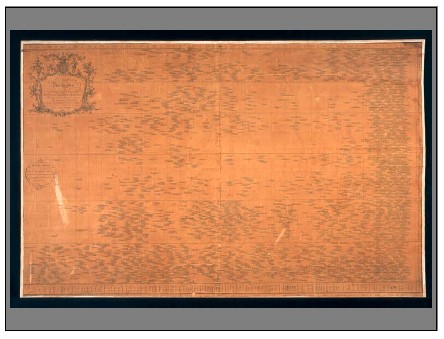
Figure 1: Joseph Priestley, Chart of Biography, 1765. Company of Philadelphia
It was not only scholars who imitated Priestley's method; during the eighteenth and nineteenth centuries, readers of history books themselves began taking notes with the assistance of this new device. Manuscript notes in copies of Priestley's books attest to the skill that his readers quickly acquired in making their own timelines and in annotating his.[10] In some instances, these additions and revisions became the basis for new printed charts, in others, they were used and circulated in manuscript: John Dickinson, a signer of the American Declaration of Independence and an early governor of Delaware received as a gift a two foot by two foot handmade chart of history after the style of Priestley.[11] Related graphic forms can also be found in a wide range of different applications in the late eighteenth century including Thomas Jefferson's 1782 chart of the growing seasons of vegetables.[12]
As aids to the study of history, Priestley's charts were recommended by numerous pedagogical manuals of the day.[13] As models for the graphic presentation of data, they exerted a deep influence: they were, in fact, the only precedent recognized by William Playfair, the central figure in the early development of statistical graphics.[14] Perhaps the most important interpretation of Priestley's timelines occurs in Playfair's Commercial and Political Atlas of 1786 and his Inquiry into the Permanent causes of the Decline and Fall of Powerful and Wealthy Nations of 1805.[15] In these works, Playfair acknowledges his debt to Priestley's method and explicitly juxtaposes historical timelines of the sort pioneered by Priestley with the line graphs that had, by then, become Playfair's own stock and trade. It is notable that in the 1766 statement of the Royal Society marking Priestley's induction, it is his Chart of Biography rather than his scientific work that is mentioned. A theological polemic published several years later omits Priestley's name, referring to him only as "the author of the Chart of Biography."[16]
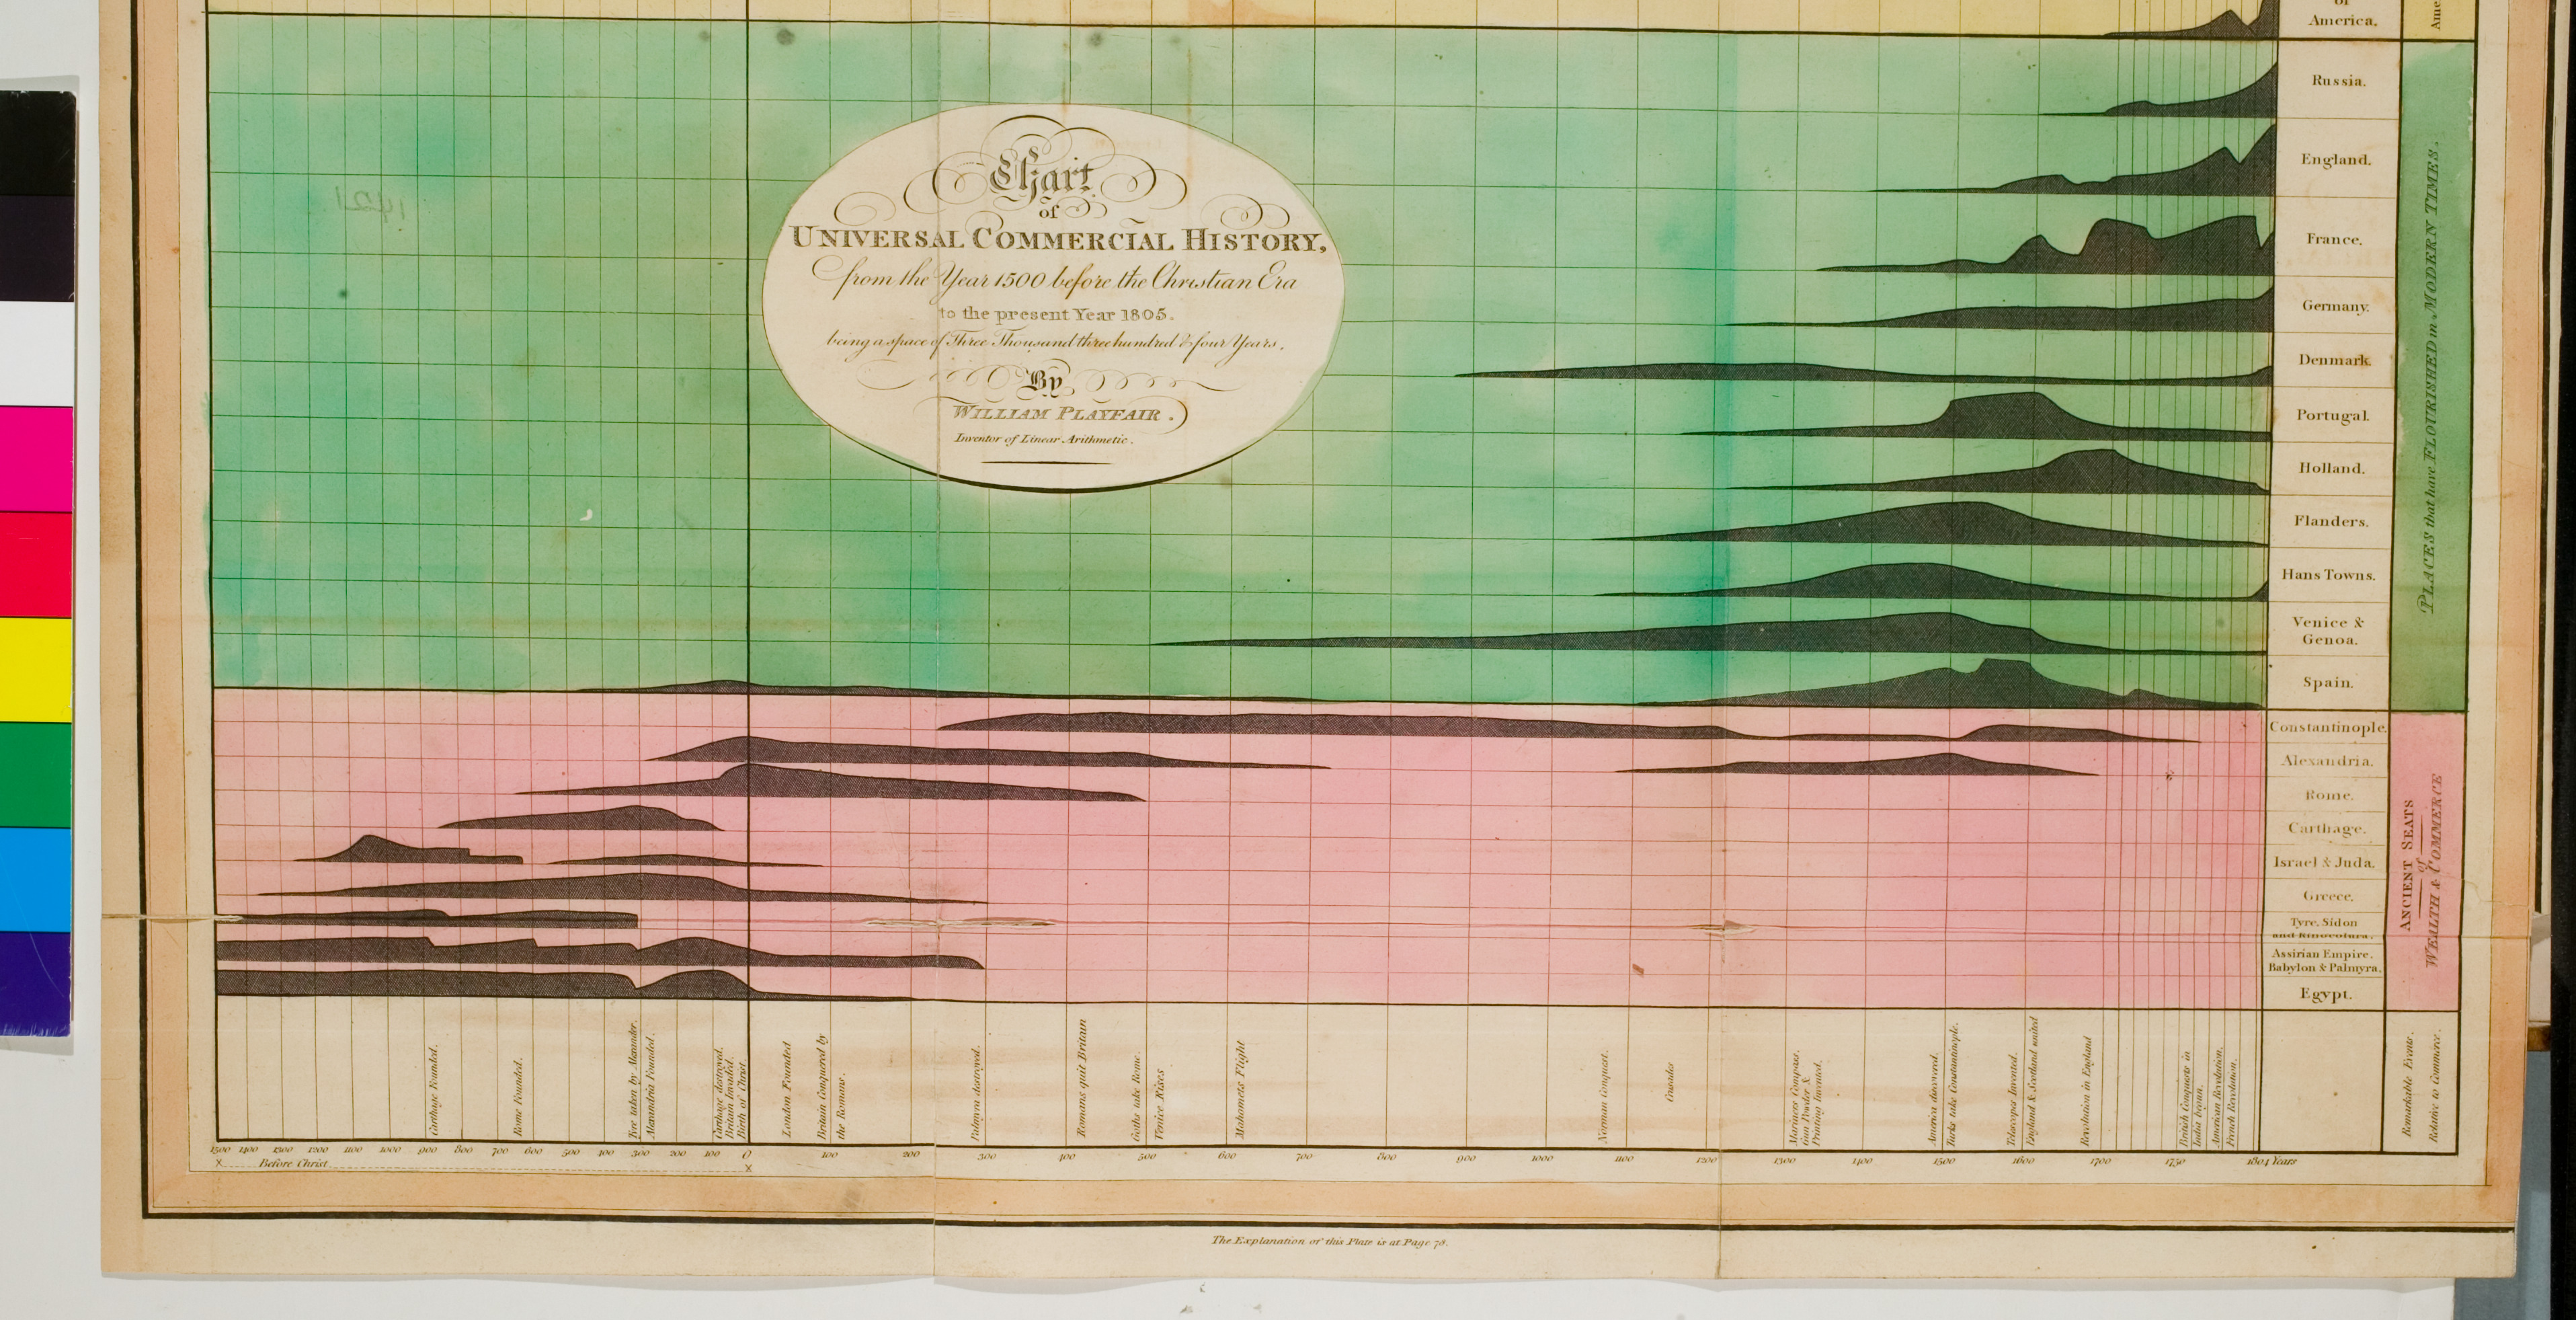
Figure 2: William Playfair, Inquiry into the Decline of Nations, 1805. Department of Rare Books and Special Collections, Princeton University Library.
The problem of inscribing chronology was not new in the Enlightenment, of course. To the contrary, for many centuries, Biblical scholars had argued over fine points of chronology. And every historical culture has produced its own mechanisms of chronological inscription. The Persians had their king lists; the Greeks, their tables of Olympiads; the Romans, their fasti, and so forth.[17] Indeed, it is conventional wisdom that such mechanisms of chronology must precede those of true historical narrative. In fact, as Hayden White has argued, it has usually been difficult to get historians to think of pre-modern chronology as anything more than a rudimentary form of historical representation. The traditional history of history traces a path from the enumerated (but not yet narrated) medieval date lists called "annals," through the narrated (but not yet narrative) accounts called "chronicles" to fully narrative forms of historiography that emerge finally with modernity itself.[18] According to conventional wisdom, for something to qualify as historiography, it is not enough that it "deal in real, rather than merely imaginary, events; and it is not enough that [it represent] events in its order of discourse according to the chronological framework in which they originally occurred. The events must be not only registered within the chronological framework of their original occurrence but narrated as well, that is to say, revealed as possessing a structure, an order of meaning, that they do not possess as mere sequence."[19]
It would seem nonetheless that by the Middle Ages at the very latest, we find in place not only the necessary techniques of representation but also the temporal framework prerequisite to the timeline. And, indeed from a certain perspective, the medieval annalists came quite close to creating timelines in the modern sense. As White notes, in the medieval Annals of St. Gall and other similar works, the manuscript page is organized in simple and separate fields containing dates and events. The dates proceed down the left hand column of the page, year by year, in a regular fashion. Events, on the other hand, appear irregularly, at least to a modern eye. Thus we get sections that read like this:
| 710. Hard year and deficient crops. |
| 711. |
| 712. Flood Everywhere |
| 713. |
| 714. Pippin, mayor of the palace died. |
| 715. 716. 717. |
| 718. Charles devastated the Saxen with great destruction. |
| 719. |
The form is tantalizingly close to that of a timeline, and I'm sure that there is an argument to be made that it already is one. But I think that we end up twisting our history out of shape if we pull too hard in this direction. It is not difficult to see how different the concerns of these writers are from those of the creators of modern timelines.
Consider, for example, the curious sideways arrangement of the years 715, 716, and 717 in this fragment. In the text, recorded years proceed one year per line down the left of the page, while events are recorded on the right. The flow of time continues whether or not the annalist deems any event to be worthy of note. In some years, events are registered (712. Flood everywhere), in others, there is nothing to show (713.). At the year 715, this pattern breaks, and three consecutive years are listed from left to right; then the regular pattern resumes. In the larger visual scheme of this text, the shift at 715 A.D. is barely noticeable. The text still looks like a chronology, even if irregular. Nonetheless, this is quite clearly an anomaly that a modern chronologer would attempt to avoid. The fact that the composer of this document was not disturbed by the graphic inconsistency (and repeated it in other places) indicates a set of structuring assumptions different from our own.
White argues that the old historiographical doxa which holds that medieval annals were nothing more than "incomplete" histories misses the point of them entirely. In fact, the form of medieval annals suggests a sense of historical plenitude that is almost unimaginable today: the aim of the medieval annalist is not to portray (as we do) the uniformity of the flow of time, but rather its unity relative to the disunity of events in the world. As White says, in the Annals of St. Gall, the flow of years itself "signals the 'realism' of the account." For its composer, "The calendar locates events, not in the time of eternity, not in kairotic time, but in chronological time, in time as it is humanly experienced. This time has no high points or low points; it is, we might say, paratactical and endless. It has no gaps. The list of times is full even if the list of events is not."[20] In a single stroke, White provides an explanation of why the Middle Ages produced so many artifacts that look so much like timelines, and why it nonetheless did not produce timelines as such. In fact, more than one revolution in historical perception would still be necessary in order to produce the manner of seeing represented by the modern timeline.
The most influential early contributions to the history of the timeline are Joseph Priestley's Chart of Biography and Chart of History and the two short books or Descriptions that he published to accompany them.[21] The charts were both elegant and massive. More than three feet wide and two feet tall, the Chart of Biography was large enough to accurately register the lives and deaths of 2000 famous men on a scale of three-thousand years in "universal time"; the Chart of History, the fates of 78 principal kingdoms during the same period.[22] The two charts were available as posters to be framed or as scrolls wound up on rollers. Designed for the curiosity and pleasure of a general reader, they were also meant to serve the scholar. In fact, Priestley believed that the two aims were well served by the same approach. If history were rendered in natural proportion, Priestley argued, chronological absurdities would quickly come to light. Faced with the chart, any child could recognize the error of the "tasteless chronologer" who by subtle calculations had managed to separate Dido and Aeneas by more than 300 years.[23]
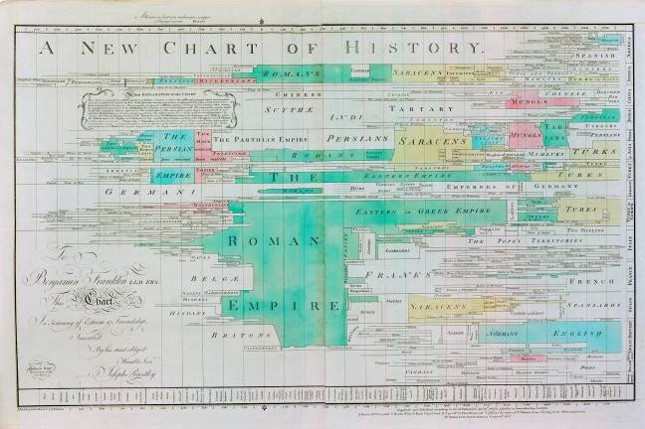
Figure 3: Joseph Priestley, New Chart of History, 1769. Library Company of Philadelphia.
As Priestley notes, both the Chart of Biography and the Chart of History obey strict graphic conventions. Along both their top and bottom edges, the charts are marked at intervals of 100 years. Between these century marks, small dots indicate decades. Dates inscribed at top and bottom are connected by vertical grid lines to make the chart easier to read. In addition, the Chart of Biography is divided by horizontal lines that separate six areas by theme. Its uppermost section is devoted to Historians, Antiquaries, and Lawyers; below them are the Orators and Critics; then come the Artists and Poets; the Mathematicians and Physicians; the Divines and Metaphysicians; and finally at the very bottom, the Statesmen and Warriors. The interior of the chart is filled to varying densities with solid black horizontal lines that begin and end cleanly at birth and death when these dates were known to Priestley or in a short or long ellipsis when they were not. Priestley's application of these markers of uncertainty is minutely calculated. He added or subtracted elliptical marks to signify more or less uncertainty, and he combined them with lines to signify a mixture of certainty and uncertainty. He even gave approximations of a whole life a rational metric: "When it is said that a writer flourished at or about a particular time, a short full line is drawn about two thirds before and one third after that particular time, with three dots before and two after it; because, in general, men are said to flourish much nearer the time of their death than the time of their birth."[24] In fact, in Priestley's Chart of Biography, the only significant concession to a non-linear form of symbolism is the names inscribed above the life lines. The biographical chart displays a striking simplicity of form. It is, Priestley argues, perfectly Newtonian: that is to say, it is "a kind of ocular demonstration" of the mathematical principles that Isaac Newton applied in his own chronological writings. There, Newton argued that many chronological controversies could be settled if the distance between generations were estimated according to mathematical averages. In Priestley's chart, these averages display themselves everywhere "as the uniformity of the course of nature requires."[25]
The Chart of History is physically the same size as the Chart of Biography, and it intentionally employs the same scale and markings: it begins and ends at the same dates and has, running along its bottom edge, an identical list of the principal rulers of each period of history beginning with the Hebrews and culminating with the eighteenth-century kings of England.[26] Priestley hoped that, by maintaining one scale for the two works, he would make it easy to use them together. Though the two could not literally be superimposed, they could be placed side by side for comparison, and as Priestley notes, readers might very easily inscribe one chart with helpful marks from the other.[27] To the biographical data of the first chart, the second adds information about historical geography and politics. To do this, it gives another dimension to the simple linear representation of time in the biographical chart. All of this it does without "crowds" of figures and explanations. Such a chart of history, Priestley writes, "renders visible to the eye, without reading, the whole figure and dimensions of all history, general and particular; and so perfectly shews the origin, progress, extent, and duration of all kingdoms and states that ever existed, at one view, with every circumstance of time and place, uniting chronology and geography, that it not only in the most agreeable manner refreshes the memory without the fatigue of reading; but a novice in history may learn more from it by a mere attentive inspection of a few hours, then he can acquire by the reading of many weeks or months."[28]
As with the Chart of Biography, Priestley presents the Chart of History in phenomenal terms. "If the reader carry his eye vertically, he will see the contemporary state of all the empires subsisting in the world, at any particular time. He may observe which were then rising, which were flourishing, and which were upon the decline. Casting his eye a little on each side of the vertical line, he will see what empires had lately gone off the stage, and which were about to come on."[29] Priestley emphasizes that this experience comes without reading. Here again, Priestley resists the lure of the symbol. He makes only one significant concession to the limitations of the simple linear graphic. To the Chart of History, he added color which allowed him to exhibit the unity of empires that "cannot be represented by continuous spaces."[30]
Both of Priestley's charts perform impressive feats of condensation. In fact, they are so large and so dense that they are difficult to reproduce. Moreover, when displayed one part at a time (electronically, on film, or in print), the aggregating effects of the works are almost entirely lost. Seeing everything together is the very principle of the works. About this, Priestley left no doubt: for him, what distinguished the charts from other sorts of chronological reference materials was what they could communicate "at one view."[31] In this way, they expressed the potential of the graphic image and amplified the virtues of historical study itself. In the charts, as in history, wrote Priestley, "the whole is before us. We see men and things at their full length, as we may say; and we likewise generally see them through a medium which is less partial than that of experience."[32] Because of their size, many of the extant charts are in relatively poor condition. It is easy for a large or a small piece to break off, and it is curious to see what happens when it does. Points and lines become unanchored and float through or fall out of the temporal space.

Figure 4: Joseph Priestley, fragment from Chart of Biography Stream of Time, 1804. American Philosophical Society.
For Priestley, the essence of the chart was to give a broad view. From a distance, to use his own analogy, the lines on the Chart of Biography should look like "so many small straws swimming on the surface of [an] immense river."[33] In some eras, these flow smoothly from left to right as in even water; in others, they bunch up or separate as the currents of history change speed. The chart is densest with biographical lines at the farthest right edge, that is to say, in the most recent historical period. This is no accident of historical record according to Priestley,
the noblest prospect . . . is suggested by a view of the crowds of names in the divisions appropriated to the arts and sciences in the last two centuries. Here all the classes of renown, and, I may add, of merit, are full and a hundred times as many might have been admitted, of equal attainments in knowledge with their predecessors. This prospect gives us a kind of security for the continual propagation and extension of knowledge; and that for the future, no more great chasms of men really eminent for knowledge, will ever disfigure that part of the chart of their lives which I cannot draw, or ever see drawn.[34]
In other words, in Priestley's view, the mass of straws accumulating at the right of the chart represents an actual historical phenomenon, the "acceleration" of the arts and sciences in his own time.[35] In a chart such as this, Priestley writes, "what a figure must science make."[36] And, indeed, on his chart, something called science literally takes on a figure, perhaps for the first time.
In the Chart of Biography, the emergence of modern science appears as a quantitative phenomenon. Scanning backward from the present, each of the categories on the chart, with the exception of two, decreases in density. The frequency with which the great thinkers and makers appear diminishes. Tracking backward through time, there is a striking drop at 1400 and a precipitous one at 1100. As Priestley notes, it is only the Statesmen and Warriors and (to a lesser extent) the Divines and Metaphysicians who appear consistently throughout time. Priestley writes,
By the several void spaces between . . . groups of great men, we have a clear idea of the great revolutions of all kinds of science, from the very origin of it; so that the thin and void places in the chart are, in fact, no less instructive than the most crowded, in giving us an idea of the great interruptions of science, and the intervals at which it hath flourished. . . . We see no void spaces in the division of Statesmen, Heroes, and Politicians. The world hath never wanted competitors for empire and power, and least of all in those periods in which the sciences and the arts have been the most neglected.[37]
Priestley sees his own chart in aggregate, but this is not for lack of interest in the individual stories that it represents. To the contrary, each name has been chosen with care, and the chart is designed as a device of reference to allow the reader to construct a historical context for every individual biography, and contemporary teachers used Priestley's chart in precisely this fashion.[38]
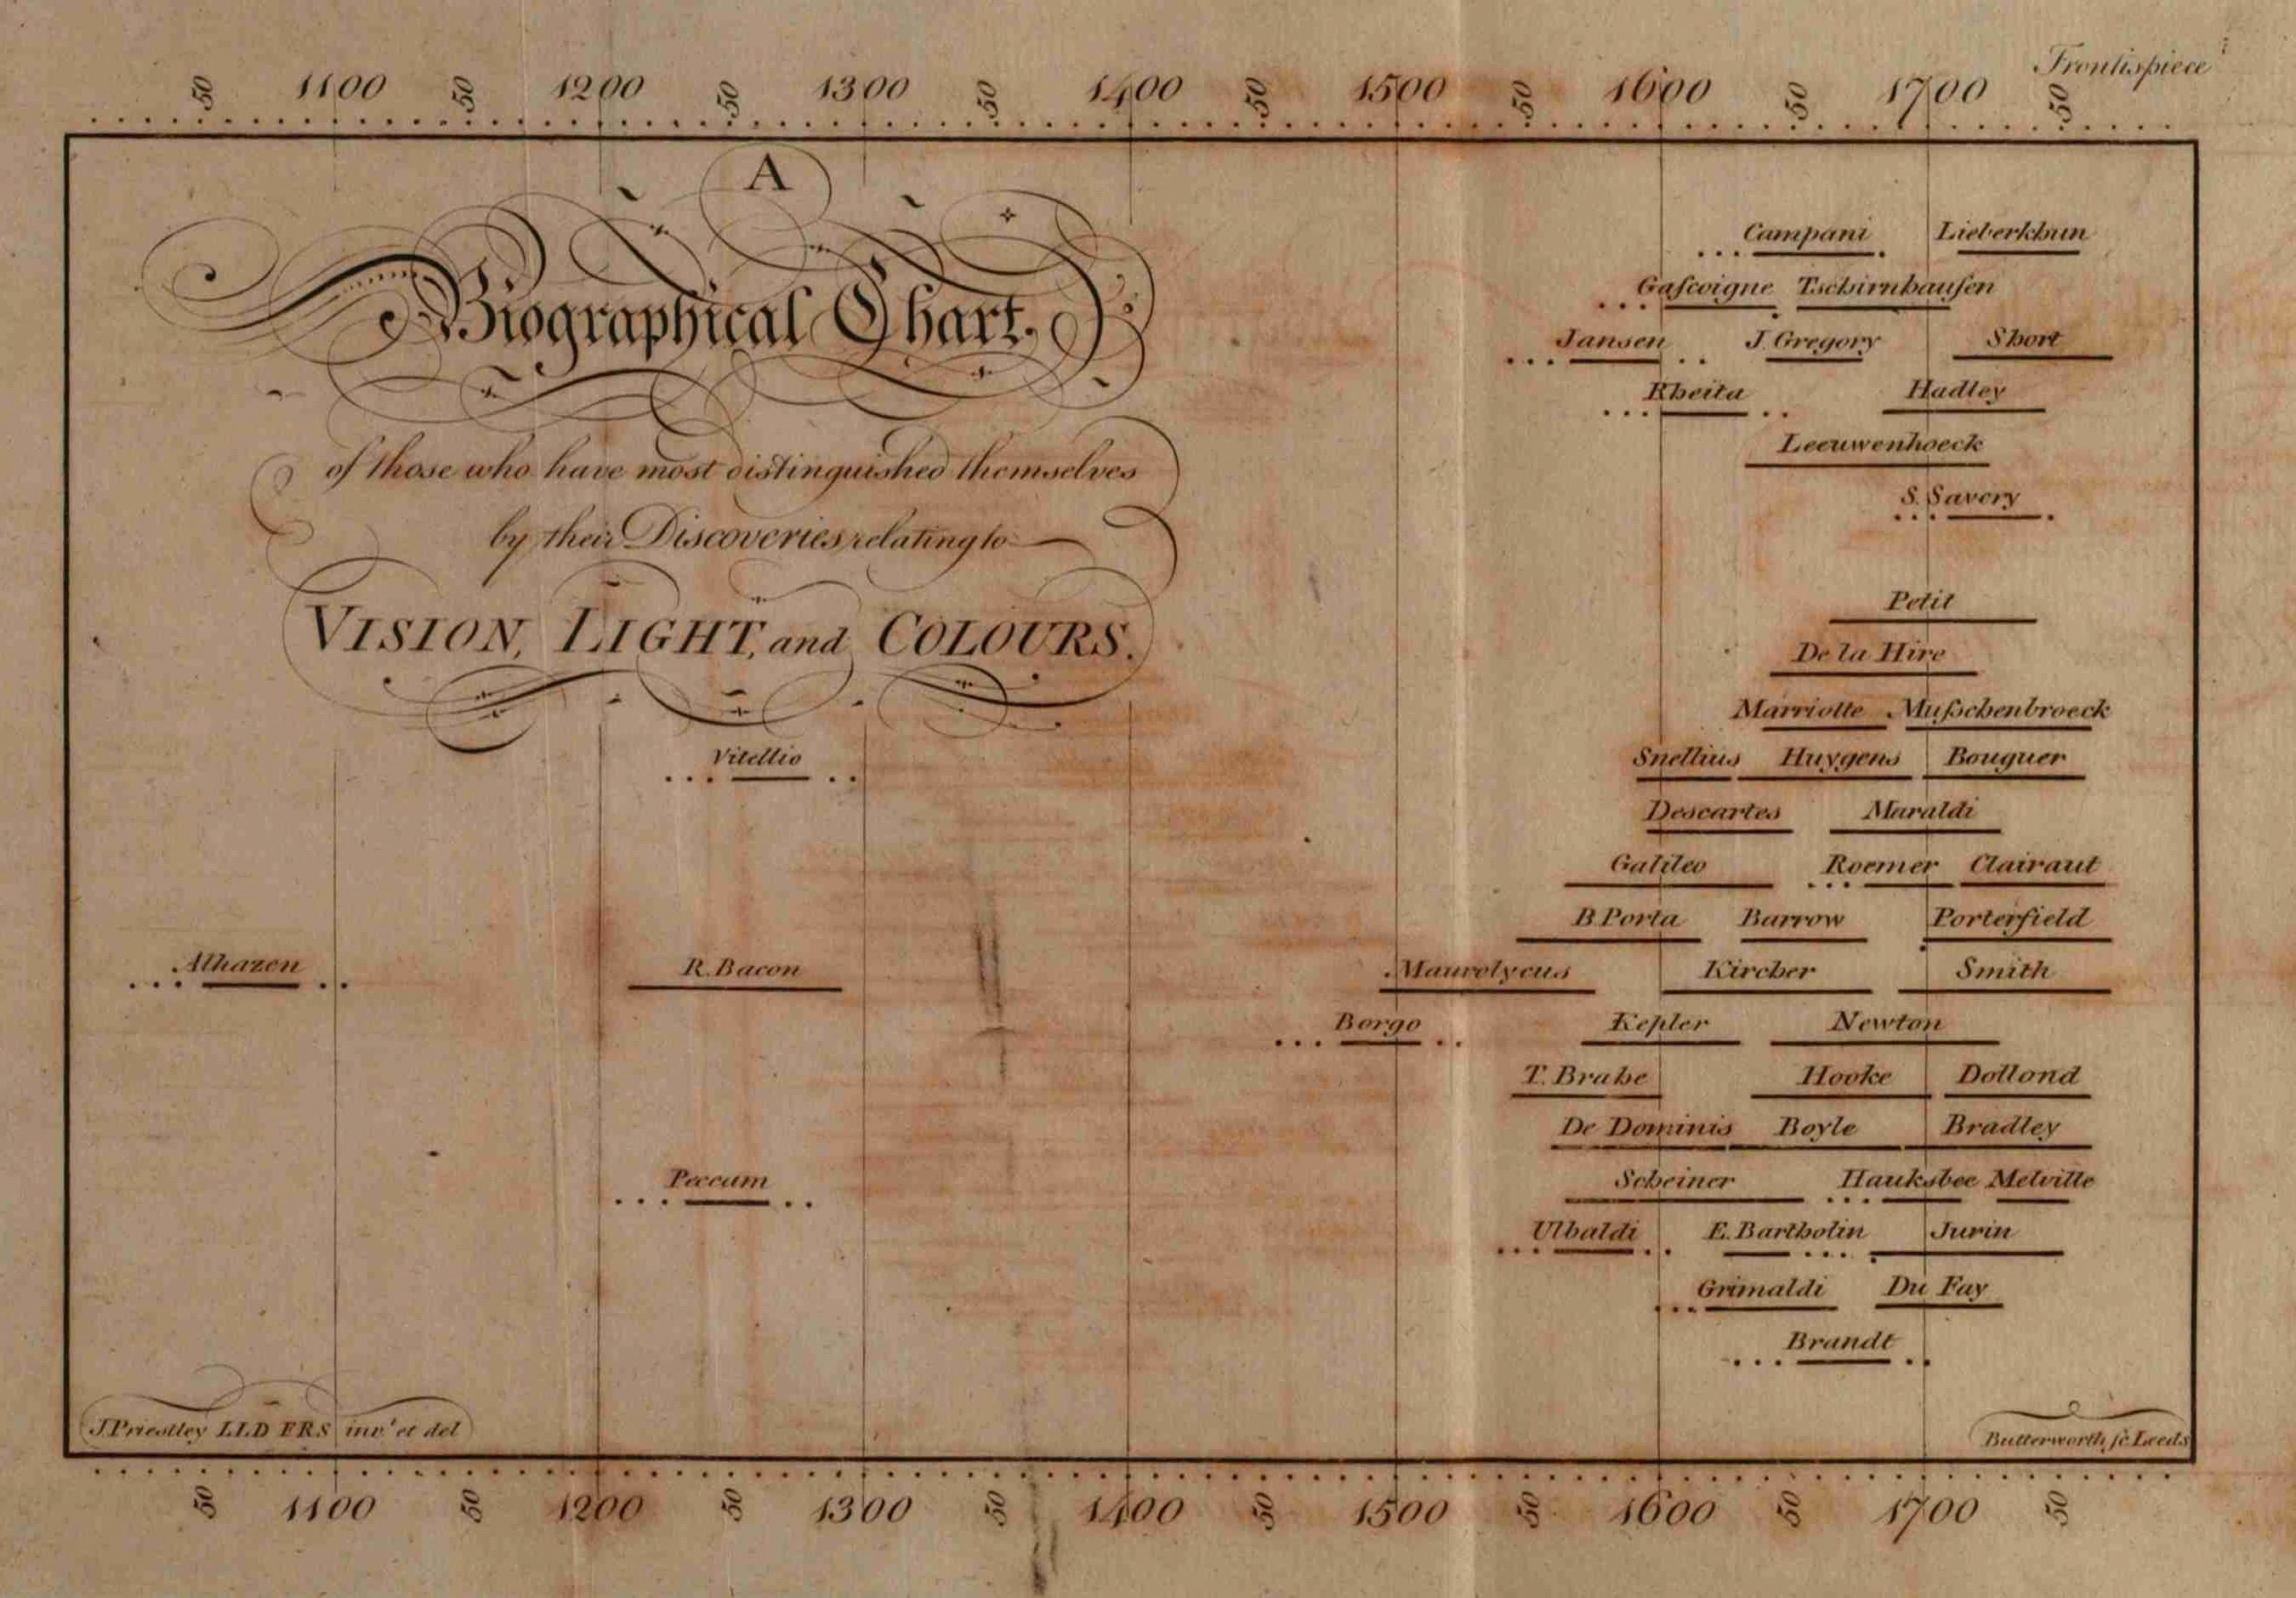
Figure 5: Joseph Priestley, A Biographical Chart of Those Men Who Have Distinguished Themselves by Their Discoveries Relating to Vision, Light, and Colours, 1772. Department of Rare Books and Special Collections, Princeton University Library.
Priestley believed that every life even the most extraordinary was best understood in relation to its time, and every biography, in relation to the others of its age.[39] He notes, for example, "It is a peculiar kind of pleasure we receive, from such a view as this chart exhibits, of a great man, such as Sir Isaac Newton, seated, as it were, in the circle of his friends and illustrious contemporaries. We see at once with whom he was capable of holding conversation, and in a manner (from the distinct view of their respective ages) upon what terms they might converse."[40] Priestley's admiration of Newton was virtually boundless, and in this and other works he dilates at length on the achievements of "that great father of the true philosophy."[41] But even in a passage such as this where Priestley concerns himself with an individual figure, the innovation of the chart is contextual: it allows us to see the individual, Newton, as a participant in a historical process. We should note also the curiously distanced way in which Priestley frames the function of the biographical lines. In the terms of the chart, life and death are nothing more than markers of relative position.
This peculiar dynamic (and it is Priestley himself who calls it peculiar) is nowhere better indicated than in a passage in which Priestley promotes the specifically graphic effect of the chart. Priestley writes,
It is plain that if a sheet of paper be divided into any equal spaces, to denote centuries, or other intervals, it will be a chart truly representing a certain portion of universal time; and if the time of any particular person's birth and death be known, it is but joining the two points of the chart which correspond to them, and you have a line truly representing the situation of that life, and every part of it, in universal time, and the proportion it bears to the whole period which the chart comprises. . . . They are the lines . . . which suggest the ideas; and this they do immediately, without the intervention of words: and what words would do but very imperfectly, and in a long time, this method effects in the completest manner possible, and almost at a single glance. . . ."[42]
Though Priestley says that names must be written on the chart, and indeed he places them there, he specifies that their function is merely indexical. The chart functions fully as a graphical representation of history without a single name being mentioned. In Priestley's words, "it is the black line under each name which is to be attended to: the names are only added because there was no other method of signifying what lives the lines stand for."[43]
It is important to emphasize that Joseph Priestley was not a lone genius working in isolation. (It would be very ironic to see him this way given the force of Priestley's own analysis of scientific invention and conversation.) Priestley's chart did not appear out of the blue, and Priestley himself never claimed such a thing. In fact, he went to great lengths to show how fundamental his idea actually was. At the same time, his account of what we might call the chronographic tradition makes quite clear where the salient differences lie. Among predecessors, Priestley points especially to two seventeenth-century scholars, Francis Tallents and Christoph Helwig (Helvicus) each of whom created what Priestley called chronological tables.[44] Such tables were common tools of both scholars and teachers during the early modern period, and they were widely employed in efforts to reconcile the evidence of pagan history with the chronologies of the Christian and Hebrew Scriptures. The organization of such charts varies. Some are simply narrative chronicles with one or more registers of years added in the margins. These nearly always include Years of the World and Years of Christ. Some also display dating systems specific to historical periods, such as the Greek Olympiads; some include universal dating systems such as the Julian Year; still others register competing scholarly opinions such as those of Eusebius or Jerome. The charts that interested Priestley the most were those, including the charts of Tallents and Helvicus, that made a more ambitious and graphically regular attempt at a synoptic display. In addition to columns for dates and events, these charts add geographic categories, allotting, for example, different columns to different kingdoms and empires. This allows the reader not only to compare systems of dating but histories themselves.
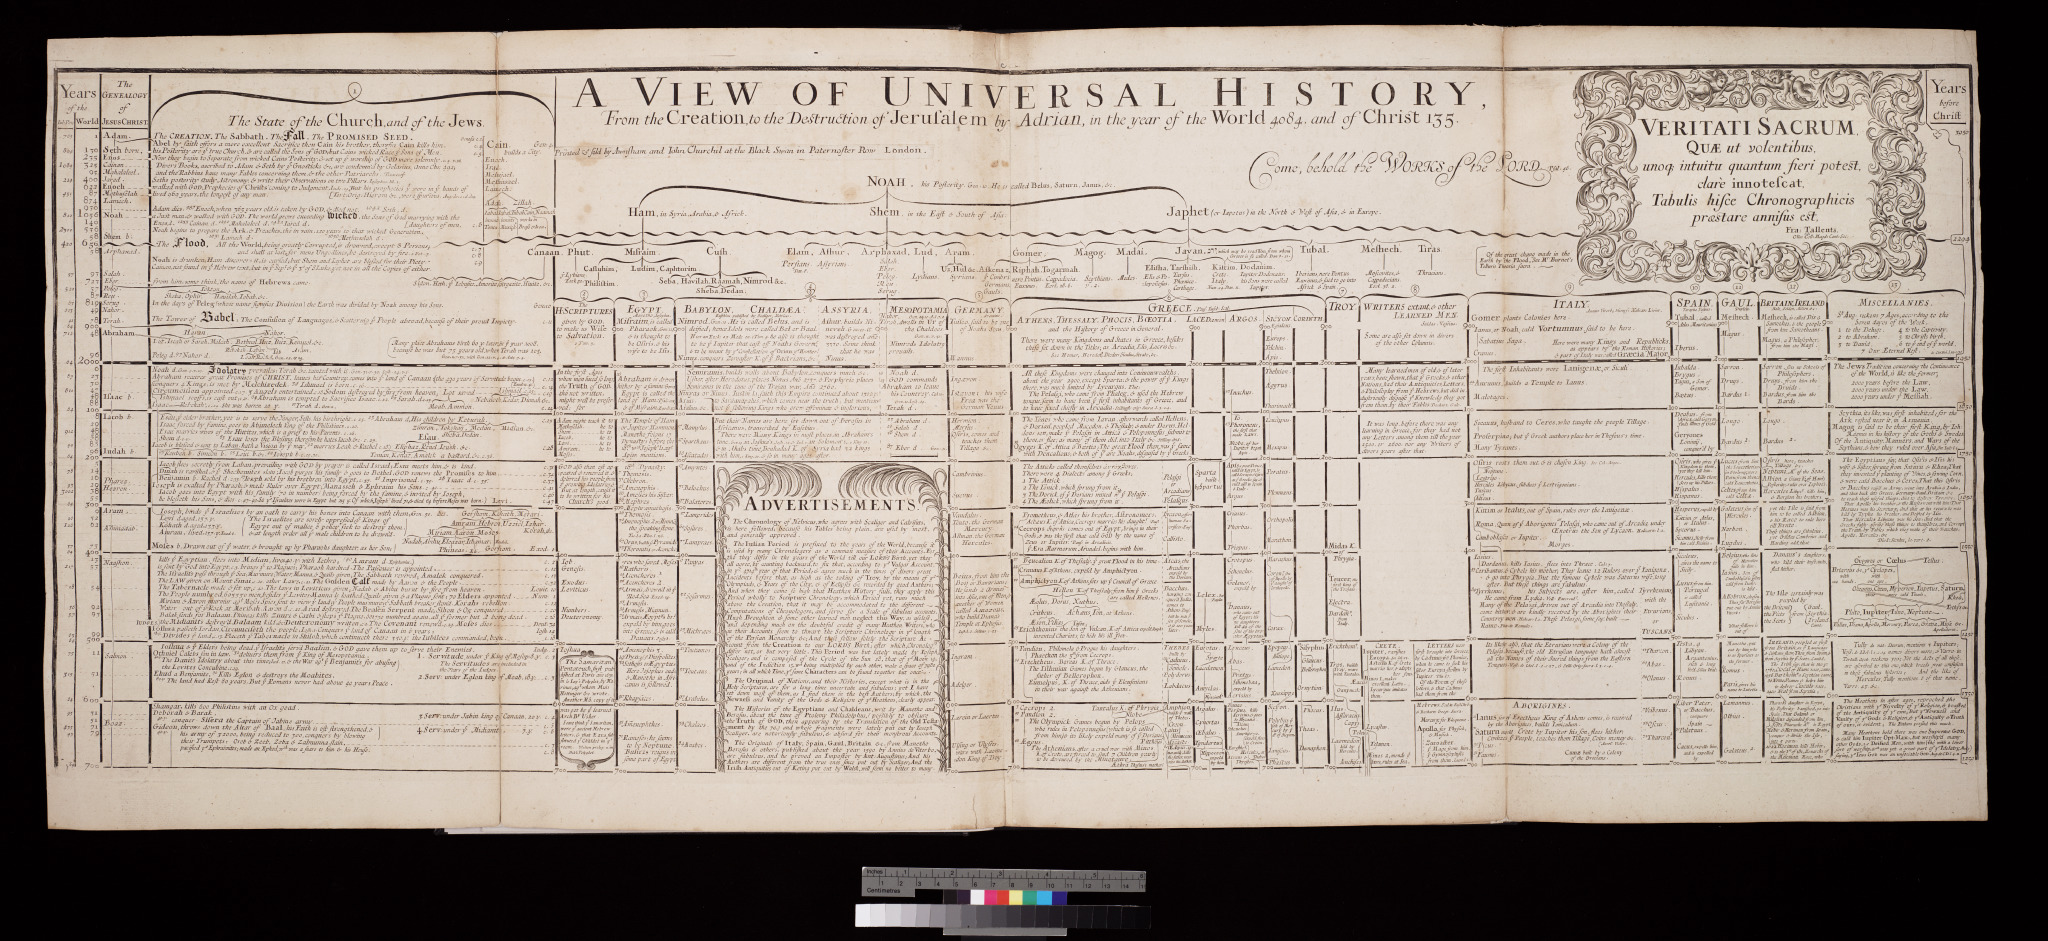
Figure 6: Francis Tallents, A View of Universal History, 1685. Department of Rare Books and Special Collections, Princeton University Library.
Priestley's relationship to this tradition of representation was complex. Though he was seriously engaged with chronological questions, he dismissed many of the internal debates in the field of chronology as sterile. He found the piling of systems upon systems to be particularly frustrating. Thus, for example, he held a mixed view of Joseph Scaliger's achievement. To Priestley, Scaliger's object, "to reduce to a certainty the different methods of computing time, and fixing the dates of events, by different chronologers," was entirely admirable.[45] Moreover, his Julian period offered a number of interesting mathematical advantages. Nonetheless, Priestley wrote, "I cannot help observing, that this boasted period seems to have been unnecessary for the chief purpose for which it was invented, viz. to serve as a common language for chronologers, and that now little use is made of it, notwithstanding all writers still speak of it in the same magnificent terms. The vulgar Christian aera answers the same purpose as effectually."[46] Priestley believed that there were real problems to be solved in the field of chronology, and that many of these were of consequence for the writing of history. But, in Priestley's view, the important historical problems were most often obscured by the arcane debates over chronological systems themselves.[47]
Nonetheless, Priestley appreciated the technical solutions to problems in historical representation that chronologers such as Tallents and Helvicus had innovated. According to Priestley, the great advantage of the seventeenth-century chronological chart lay in its ability to "reduce history into a short compass, and . . . make an entire course of it easy to be comprehended."[48] In fact, he says, even in the worst case, when such charts "consist of nothing more than an enumeration of the capital events in history, thrown together promiscuously, without any distinction of kingdoms, regard being only had to the order of time in which the events happened, they have their use."[49] For Priestley, Francis Tallents' 1685 A View of Universal History from the Creation, to the Destruction of Jerusalem by Adrian, in the Year of the World 4084, and of Christ 135 was a case in point. The View of Universal History is organized as a grid with dates descending in two columns (years of the Julian period, years of the world) at the far left of the page. A third column gives a list of patriarchs in a direct line from Adam to Jesus Christ. Further columns indicate geographical areas (from left to right, the chart moves from the Near East to Europe). At a glance, Tallents' chart gives the impression of dividing history into regular units. On inspection, however, the date columns turn out to provide something of a surprise: though the chart is regularly drawn, it does not proceed at a chronologically consistent pace. Tallents uses the same amount of graphic space, for example, to separate the seventy years from 325 to 395 as the three-hundred-ninety years between 1146 and 1536 (anni mundi). There is no inaccuracy here: with Tallents' chart, a careful reader may always refer to the dates at the left, but the graphic itself does not convey anything more temporally precise than chronological order.
Figure 7: Francis Tallents, View of Universal History, detail. Department of Rare Books and Special Collections, Princeton University Library.
According to Priestley, some seventeenth-century charts functioned better in this regard. The 1651 Historical and Chronological Theater of Helvicus (Christoph Helwig), though earlier than Tallents, showed more discipline in its metrics. In contrast to Tallents, Priestley says, Helvicus disposes "events in such a manner, as that the distance at which they are placed, without attending to the date in the margin, shall give a just idea of the real interval of time between them. This is done by having a single line, or any set space, appropriated to any certain period of time, or number of years."[50] For Priestley, this is a great advantage, but, in this case, the advantage is squandered. Priestley criticizes Helvicus for paying such lavish attention to the intricacies of comparative periodization his charts juxtapose more than 14 different chronological systems that he nearly forgets the historical uses of the table.[51] Like most of the charts of its era, the Historical and Chronological Theater, prefers the interests of the specialist chronologer to those of the historian or the general reader.
Figure 8: Helvicus, Historical and Chronological Theater, 1651. Department of Rare Books and Special Collections, Princeton University Library.
In fact, together Tallents and Helvicus make good representatives of early modern chronography. It would not be difficult to add other names, and some who are more important in the big chronological picture. Certainly, we would want to mention Joseph Scaliger, James Ussher, and Isaac Newton.[52] But Priestley is perceptive in this regard. The major figures in chronology were not the most important figures in chronography. Priestley himself points out that Newton's chronologies were not graphic. They were presented as simple date lists. This is especially striking given Newton's familiarity with the power of scientific illustration, and given his use of illustration in this same work.[53] Scaliger, for his part, made many charts, but like Helvicus, his principal concern was to align varying historical chronologies, not to illustrate the flow of history as such.[54]
As for Ussher, he has perhaps a more important role in the specifically chronographic dimension of this story. Though he himself did little to change the way in which events were inscribed in historical tables, his influence led directly to the mainstreaming of the chronological project during the seventeenth century. Ussher's famous calculation that the world was created at precisely 6 pm on Saturday October 22, 4004 B.C. was very much in line with then current chronological thought. But under Ussher's influence, this dating became dogma for the Anglican Church, and by 1701, it had actually made it into the margins of an officially sanctioned Bible.[55] Looking at the dates that run down the sides of the pages of this book, it is easy to make an imaginative jump to the timeline. But we have to be careful: in fact, in this chronographic format, we are actually farther away from the timeline than we were in the Annals of St. Gall. There, at least, regularity in temporal denomination was the pattern if not the rule. Here, quite the opposite is the case. Dates flow only along with the narrative.[56]
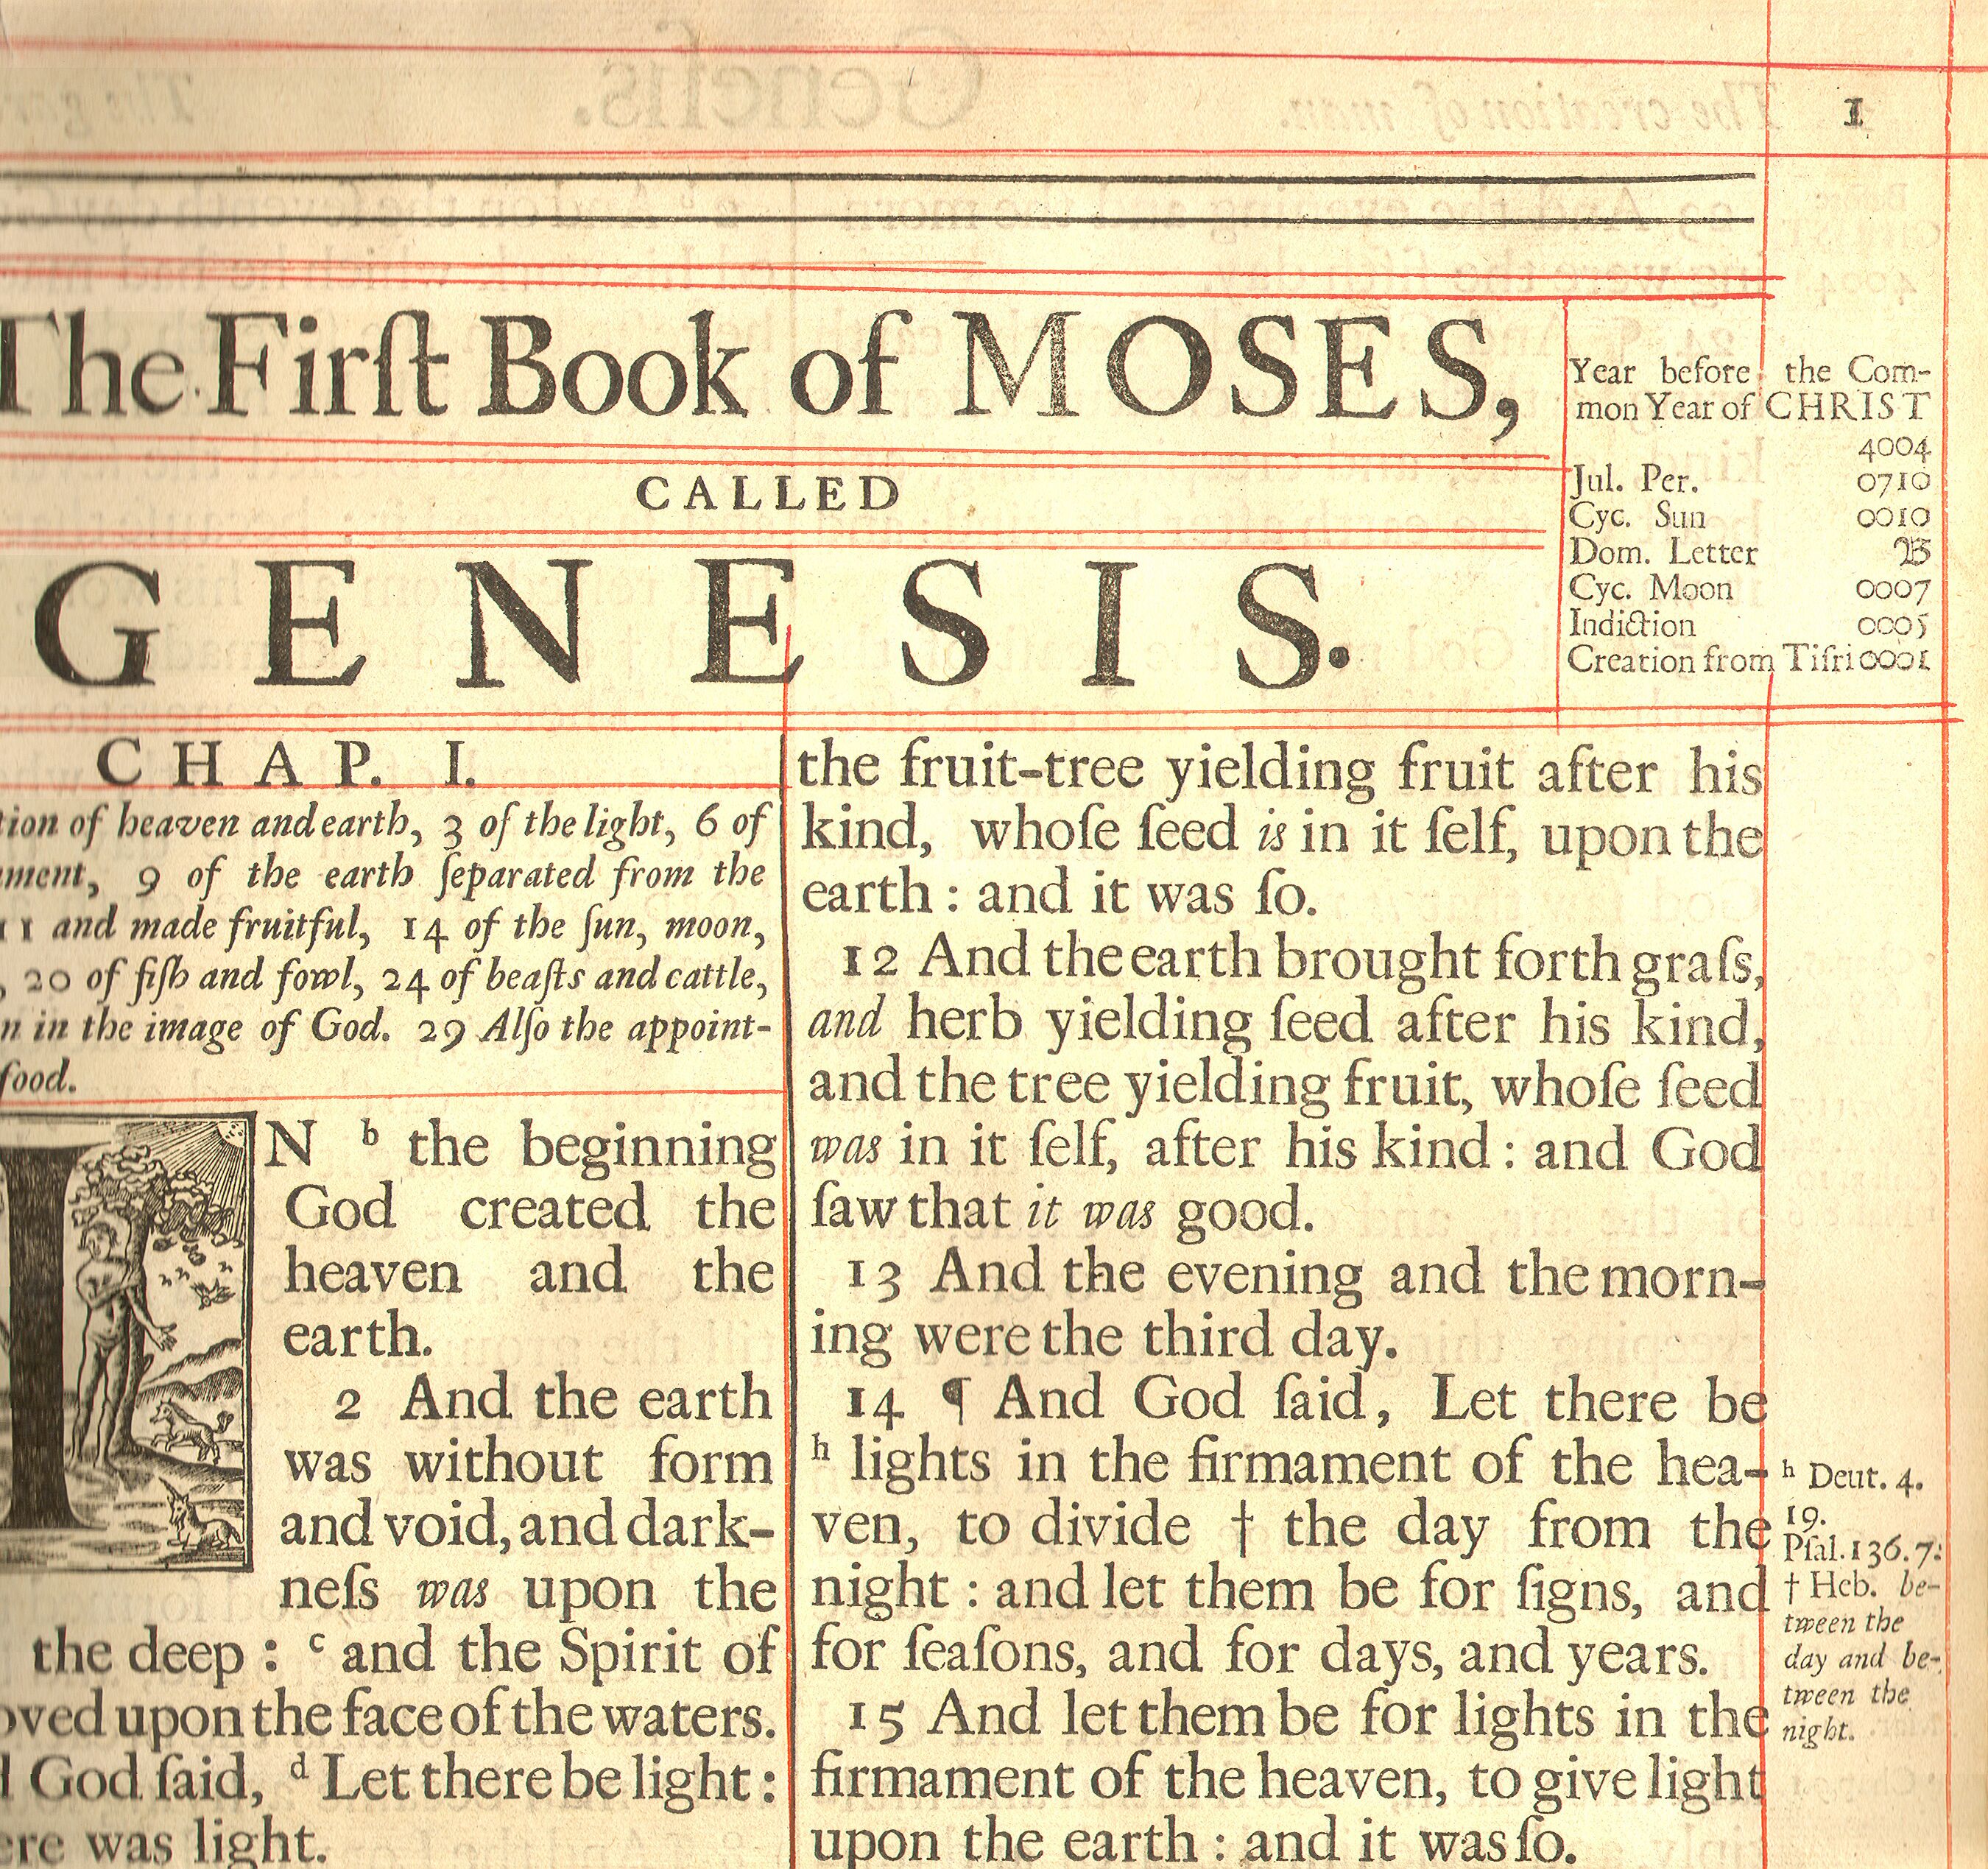
Figure 9: The Holy Bible, containing the Old Testament and the New, 1701. Whitman College Library.
In this sense, Ussher's approach is continuous with that of Tallents. As we have already seen, according to Priestley, Tallents had created a tool that could be useful in the teaching of history. But his chart remained so deeply invested in the stories that it wants to tell that it breaks out scale in just about every direction possible. Though in certain places, chronometric inconsistencies in Tallents come across as oversights, in most, they are central to the project of the chart as, for example, where Tallents digresses into Biblical narratives, comments on chronological controversies, or refers to supporting texts; or where he introduces symbols of various sorts (a waving line for the universal deluge, a flourish for the end of the Old Testament, a typographic break for the birth and the death of Christ) or switches representational registers altogether where the chart opens out from a grill of rows and columns into the panorama of a genealogical tree.
The innovation of Priestley was not to improve upon the mechanism of Tallents but to shift the basic concerns of chronography away from the representation of particular events and toward the representation of time in general. Ironically, in some ways, this shift led Priestley back in the direction of the Annals of St. Gall. And here, the proximity of the form of the annals to that of the timeline begins to come into better focus. As Hayden White has argued, for the annalist, events are endowed with meaning "by being identified as parts of an integrated whole." Or, he says, "To put it another way, the list of dates can be seen as the signified of which the events . . . are the signifiers."[57] While this is not quite true for Priestley, something parallel is: as in the medieval case, we can think of the lives and deaths of the historical figures on Priestley's chart as signifiers of something else; but, in contrast to the medieval chronology, here what is signified is not the unity of history but its uniformity.
Priestley emphasizes that he was not the first to make a move in this direction. It is the very principle of John Blair's 1753 Chronology and History of the World, from the Creation to the Year of Christ 1753, a book which registers events as on lines in a notebook, with one line devoted to each year of history.[58] Blair himself criticized Tallents for "one great and fundamental Mistake" which was to ignore "the Series of single Years."[59] According to Blair, "this Principle is the most essential, in the Texture of a Chronological Table. For it is in Chronology as in Musick, where the Harmony does not arise, from any single Note, or from any Number of Notes, but from their being properly proportioned and tuned to each other; where, without the exact Disposition of Time and Place, the true Unison of Concert is broke, and the best Musick may become Discord."[60] It is notable that Blair refers to the register of music, as musical notation represents one of the most abstract applications of graphic form to the problem of time.[61] For Blair, chronology was meaningless without meter. "The Series of Time," he writes, must be represented "according to its proper Periods; the Interval of Occurrences; THREAD OF HISTORY: without which, it is really nothing more, than a Bundle of detached Fragments."[62]
Priestley's commitment to representing time in a uniform manner led him to define the historical limits of his chart in a way that was different from most historical charts previously published. The great majority of these (including Helvicus, Tallents, and Blair) begin with the beginning of time itself.[63] There were, of course, manifold problems in representing the beginning of time. Some of these were philosophical, others were chronological. In Priestley's day, as in our own, scholars disagreed radically about the age of the world.[64] But, for Priestley, the principal problem was not the controversy about the beginning of time. Indeed, as we have seen, Priestley was an innovator in the realm of representing uncertainty.[65] The problem was that if a chart were to begin at the beginning of time, it would either have to include a large amount of unutilized space or it would have to sacrifice its temporal regularity. Even Blair, committed as he was to the meter of history, found no practical way to apply a single scale to the first and to the last ages of the world.
In this regard, it is interesting to compare Priestley's biographical chart to Jacques Barbeu-Dubourg's Carte chronographique, published the same year as Blair's work, in 1753.[66] Along with Priestley, Barbeu-Dubourg constructed one of the first charts that can properly be understood as a timeline. While the charts of Helvicus and Tallents took the form of a grid, and Blair's table that of a ledger, Barbeu-Dubourg's actually unfolded along a linear plan. At the same time, his chart was much more formally heterogeneous than Priestley's. Indeed, its key reads like the Chinese encyclopedia in Borges: it includes glyphs for republic and kingdom, rebellion and interregnum, but also for astronomer, martyr, woman, mad, cruel, killed in war, poisoned, and impostor. Despite this symbolic scatter, like Priestley, Barbeu-Dubourg aimed to maintain a constant scale of time throughout his chart. While this resulted in many of the salutary effects described by Priestley, it also resulted in at least two strange ones. First, the chart became incredibly long. At fifty-four feet, it is truly astonishing to see. The work was usually presented as a scroll installed in a special viewing "machine." The box contained two spindles and cranks so that the viewer could move through time easily.[67] But, for Priestley, such length defeated one of the major purposes of such a chart: it no longer presented history "at one view." The other side-effect of Barbeu-Dubourg's representational strategy is the curious triangular shape of his chart. As a viewer scrolls forward in time on the Carte chronographique, the frame of history actually grows. At the beginning, it offers only categories for remarkable events of a spiritual and of a human nature. But as time passes and history grows fuller, it recognizes more and more categories of information, and the frame of the chart expands.
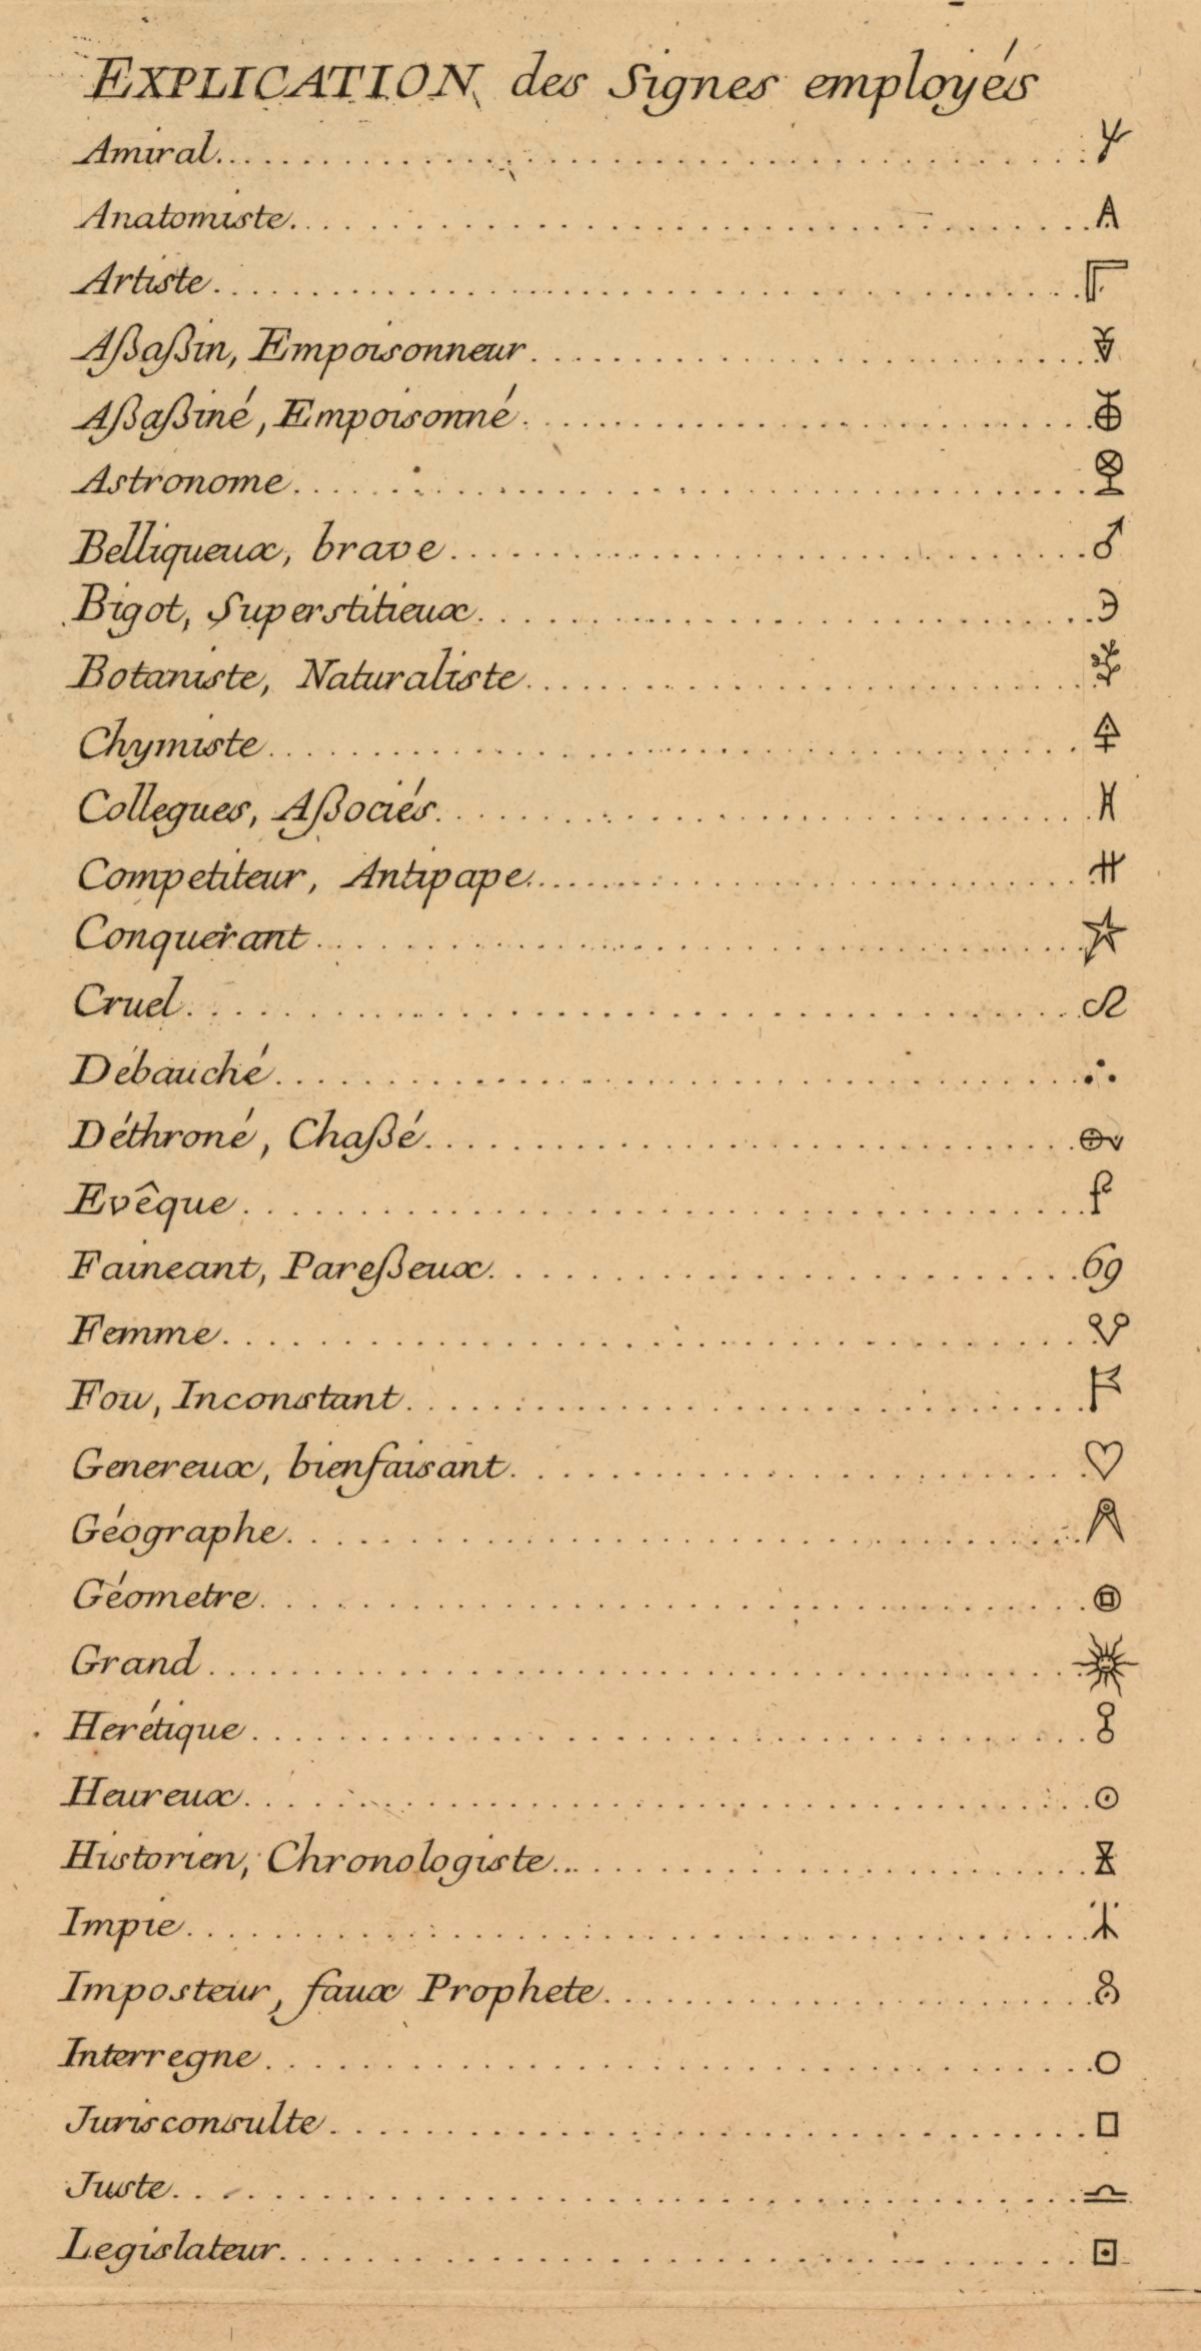 Figure 10a: Jacques-Barbeu Dubourg, Key to Chronographie, 1753 |
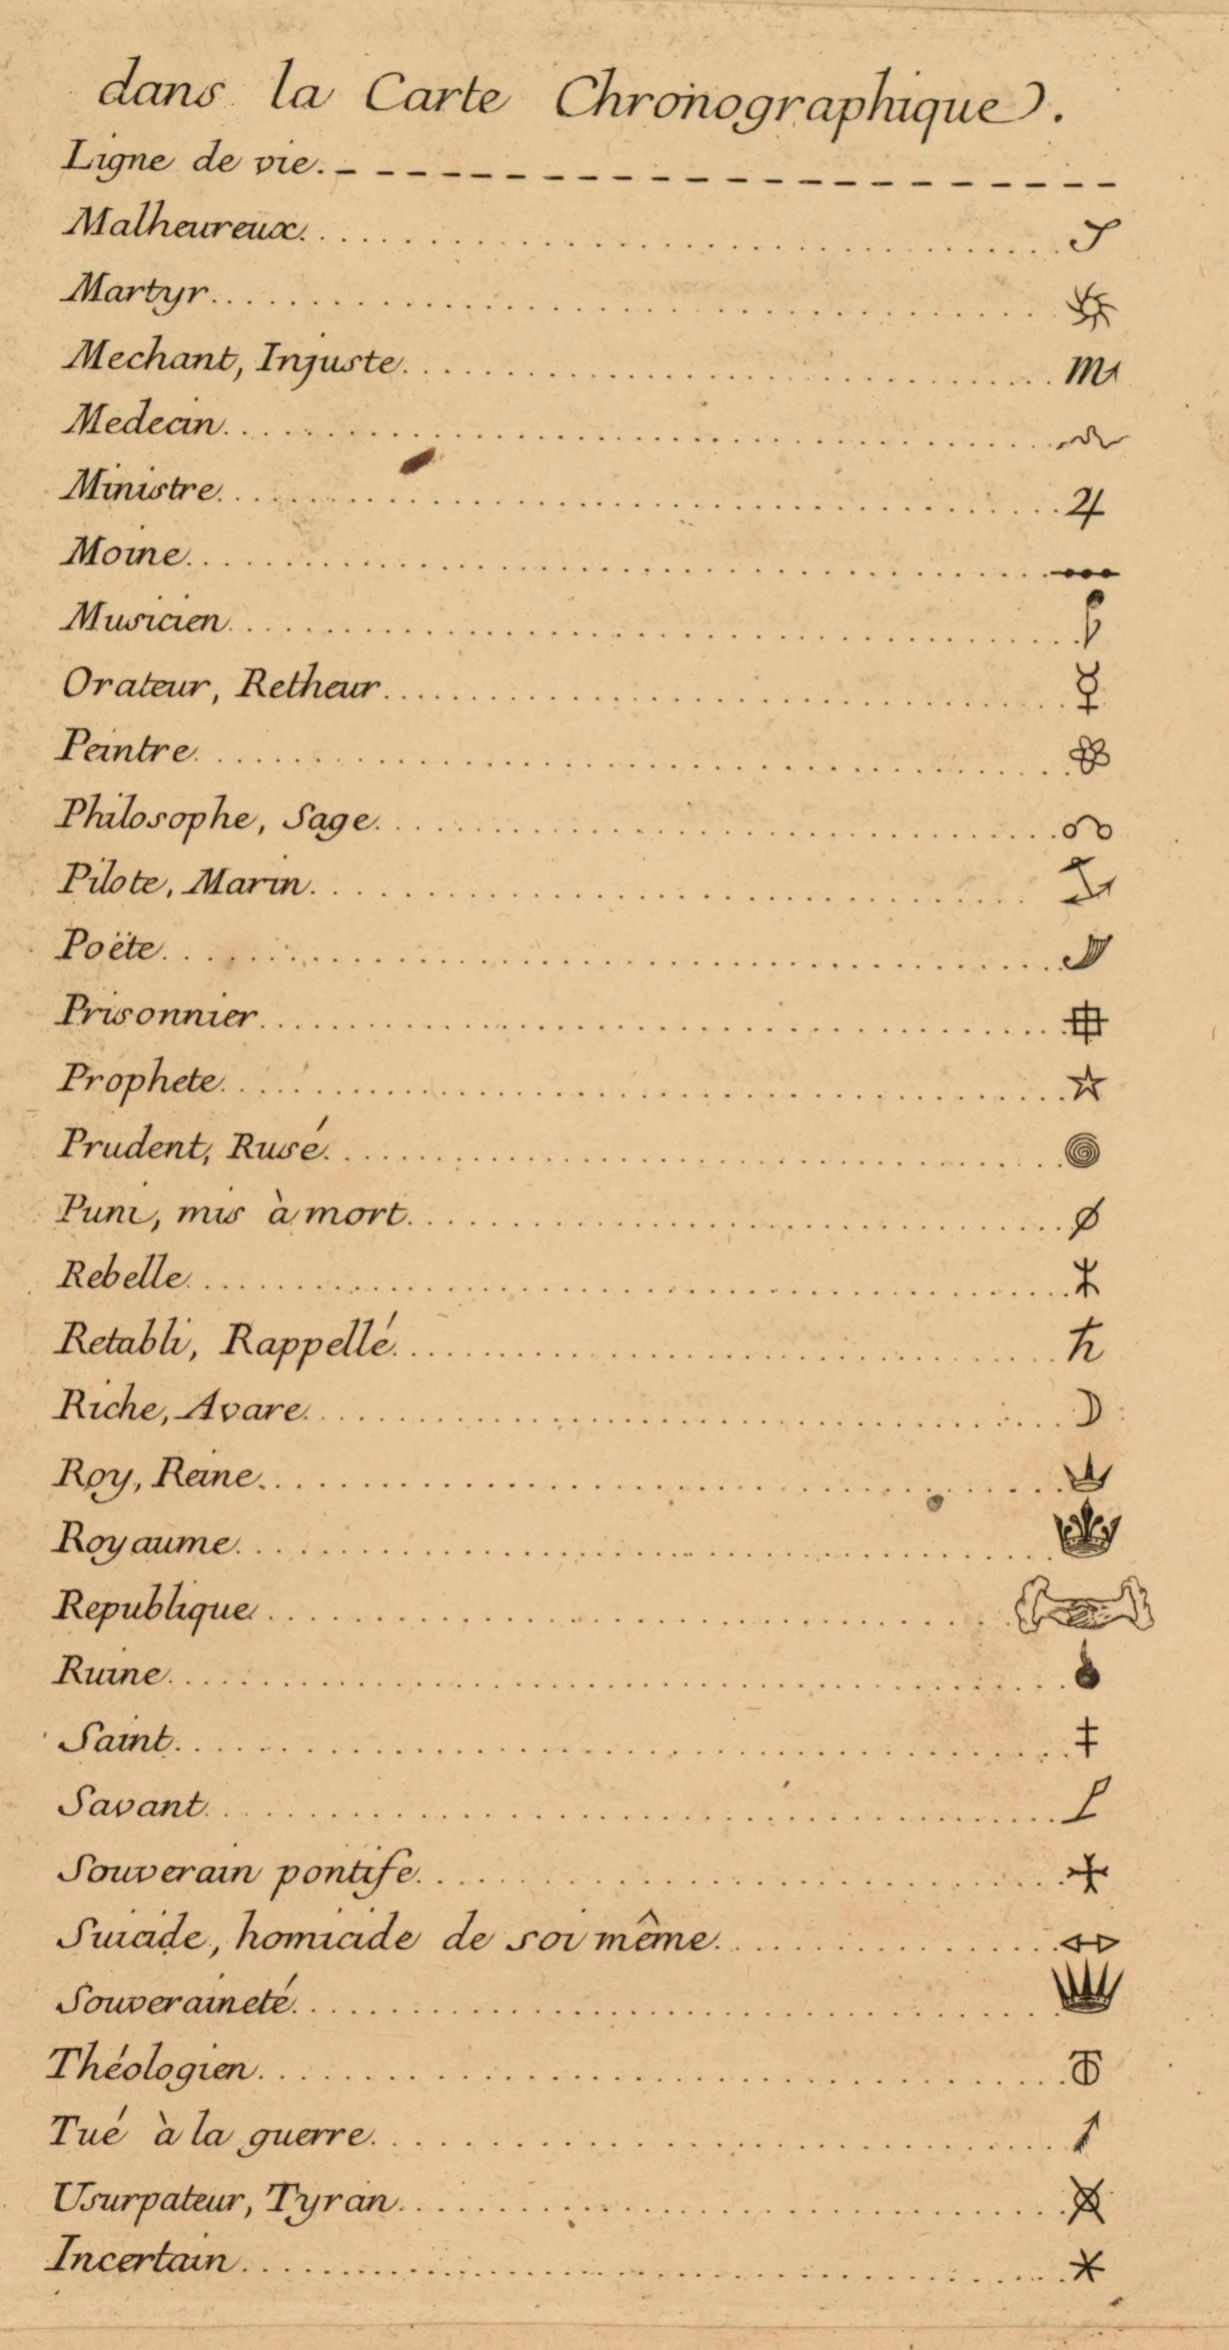 Figure 10b: Jacques-Barbeu Dubourg, Key to Chronographie, 1753 |
Priestley's strategy was different. Both his Chart of History and Chart of Biography moot the question of creation by beginning in media res with the reign of King David in 1200 B.C.[68] In fact, in some editions of his Description of a Chart of Biography, Priestley includes a small supplementary chart to cover the first years of the world. It is telling to observe that Priestley explains this choice with reference to a problem of representation rather than a problem of history. By beginning with the later date, Priestley was able to keep the chart to a single, synoptic image and at the same time to maintain a uniform representation of time.[69]
This is not to suggest that Priestley's chart was perfectly convenient. Though a tiny fraction of the size of the Carte chronographique, it was still too big to fold into a book or to carry, and, without a proper space, it wasn't even especially easy to hang. In 1803, Priestley's American publisher, Matthew Carey decided to do something about this: he broke the chart into 20 smaller pieces and published it as a bound quarto volume. The resulting work has the advantage of portability, but despite Carey's insistence that the new format "cannot affect the principles" of the work, the 1803 version loses nearly all of the advantages of sequence and juxtaposition of the original.[70] In fact, Carey's version of the chart is very difficult to use. Different pages include different selections of biographical categories. And, what is worse, the scale changes radically from page to page. It is no wonder that Priestley became so angry when he was informed of the new edition of the work after its publication. In the nineteenth century, one frustrated reader made a manuscript index to the work.[71]
Index to the Charts
| B.C. | no | 1 beginning with | 4000 |
| 2 | 1200 | ||
| 3. 4. 5 | 600 | ||
| A.D. | no | 6. 7. 8 | 0 |
| 9. 10. 11 | 600 | ||
| 12. 13. 14 | 1200 | ||
| 15 to 20 | 1500 |
| A.D. | 0 | 600 | 1200 | 1500– | ||
| (Hebrews) | 1 | |||||
| Statesmen & Warriors | 2 | 3 | 6 | 9 | 12 | 15 |
| Divines & Metaphysicians | 2 | 4 | 7 | 10 | 13 | 16 |
| Math'ns & Physicians | 2 | 5 | 6 | 11 | 14 | 17 |
| Artists & Poets | 2 | 5 | 7 | 10 | 12 | 18 |
| Historians, Antiq's, Lwyrs | 2 | 4 | 8 | 11 | 14 | 19 |
| Orators & Critics | 2 | 3 | 8 | 9 | 13 | 20 |
| B.C. | 1200 | 600 |
But the complexity of this effort only demonstrates that much more clearly the ways in which the new work violated the principles of the old.
It is a curious thing to observe how much argumentative work Priestley felt compelled to do in order to justify and explain his conception of the timeline. Though time, he says, is an abstraction that may not be "the object of any of our senses, and though no image can properly be made of it, yet because it has a relation to quantity, and we can say a greater or less space of time, it admits of a natural and easy representation in our minds." The natural form of this representation, he argued was that of "a measurable space, and particularly that of a line."[72] In presenting the Chart of Biography, Priestley shows a keen awareness that what appears already "natural" to him is likely to appear a "mechanical contrivance" to his readers.[73] Like George Lakoff and Mark Johnson, Priestley argues that the linear figure is present even in places where it typically goes unnoticed: "it is probable that all persons whatever, without attending to it, actually have recourse to this method whenever they compare two or more intervals of time in their minds."[74] As a way of demonstrating this, Priestley points to common expressions that refer to time. Like Mitchell, he notes that the terms "long" and "short," though used universally to describe temporal intervals, are in fact only metaphors drawn from the realm of the visible. "It is plain that when any person applies the terms long and short to the idea of time without apprehending any figure, or sensibly perceiving any harshness in the application, to him the properties of real length and shortness are the natural properties of time; and consequently the idea of something which hath length or shortness is actually suggested by the terms. And what can this be but the idea of a line, or at least something lineal?"[75] For this reason, above all, the human mind should be well disposed to the graphic timeline. In the weak medium of language, it is already striving toward precisely this graphic form.
Priestley gives an example: if a speaker tells you that Plato lived a long life and Terence a short one, the meaning is clear enough, but as soon as he or she begins to add elements of precision or complexity to the comparison, the clarity of the original statement is lost.
Let me desire the reader, for his satisfaction, to make an experiment of the use of the chart, by means of no more than five names . . . . Let him attend only to his own ideas, though as carefully as possible, while he reads, that Pindar died 435 years before Christ, aged 86; Sophocles died 406, aged 91, Xenophon died 359, aged about 90; Plato died 348, aged 81; and Terence died 159 aged 35. Is it now easy, from these numbers, and all the mechanical assistance to which any person's mind is habituated and can have recourse, to form a clear idea of how these lives stand related to one another in the whole length of them? Can you even tell without an arithmetical computation, whether Plato or Xenophon were born first, though twenty years intervened betwixt them? Please now to inspect the chart, and as soon as you have found the names, you see at once glance, without the help of arithmetic, or even of words, and in the most clear and perfect manner possible, the relation of these lives to one another in any period of the whole course of them.[76]
All that is necessary to perform this complex operation, according to Priestley, is a simple sheet of paper divided into equal spaces and a (temporary or permanent) agreement on a universal scale of time.
Priestley carried forward the linear concept from his Chart of Biography to his Chart of History, but there it functioned in a somewhat different way. In the second chart, just as in the chart of Tallents, Priestley sought to establish a relationship between ideas of place and time.[77] This created a productive tension. The divisions of the Chart of Biography are thematic: statesmen are grouped with statesmen, and so on. In the Chart of History, as in the charts of Tallents and Helvicus, the principal divisions are geographic. Each part of the world, including Africa, Asia, Europe, and America is represented by a horizontal region of the diagram. In many instances, it is simple to represent the period of kingdom on such a chart. A French king in France presents no more trouble than the biographical lines of the earlier chart. But, as Priestley explains, political history is often thornier than this. Alexander held lands on three continents, the British Empire, even more. To deal with this complexity, Priestley resorted to a new technique, using color to indicate lands held by a single empire but not contiguous on the chart. As on the Chart of Biography, on the Chart of History, historical time was figured as a uniform "flow" from the beginning to the end of the "tablet."[78] All of this represents a convenience, and here Priestley expresses another temporal concern woven into his larger argument. Both charts are designed as time-saving devices. Priestley, like many of his contemporaries, was concerned about a rapid expansion in the field of historical knowledge. Thus, the fact that "a more perfect knowledge of . . . history may be acquired by an hour's inspection of this chart, than could be acquired by the reading of several weeks," was not the least of its benefits.[79]
In Priestley's view, history in the present was quickly speeding up. "Progress," as he put it, "is really accelerated."[80] In the seventeenth and eighteenth centuries, rapid advance could be observed in nearly every aspect of the arts and sciences. For this reason, biography in these fields was for Priestley an inherently uplifting subject. In fact, its contemplation brought him pleasure and a confidence in the providential dimension of history that might otherwise appear to be excluded from the design of the chart. For Priestley, the contemplation of intellectual progress evoked a sense of sublimity that was in itself a sign of greater things.[81] For this, the Chart of Biography was a natural and perhaps a necessary aid. Priestley argues that progress, though easy to measure, can actually be quite difficult to perceive. The more things change, the more that change is expected and the less that it is noticed. "The increase of knowledge," Priestley writes, is like the increase of a city. The building of some of the first streets makes a great figure, is much talked of, and known to every body; whereas the addition of, perhaps, twice as much building, after it has been swelled to a considerable size, is not so much as taken notice of, and it may be really unknown to many of the inhabitants."[82] A chart such as his, Priestley believed, had the value of revealing the changing speed and intensity of these philosophical developments.
Priestley's chart aims to demonstrate another important thing too: in a society in which communication is cultivated, progress is self-reinforcing. "Great improvements in science are not . . . to be expected from men confined to their closets," writes Priestley.[83] In order for progress to actually accelerate, the circulation of scientific ideas, methods, and facts is essential. Priestley had a great deal to say on this subject. On the one hand, he was a great supporter of institutions of scientific communication such as the Royal Society of London, the Lunar Society of Birmingham, and the American Philosophical Society, to all of which he belonged. On the other hand, he strongly opposed the intervention of institutions in the practice of science and cautioned against allowing them to grow too large, too bureaucratic, or too powerful.[84] The key to progress, for Priestley, was the circulation of ideas. For this reason, he argued (and here, as elsewhere, there are strong echoes of Diderot and d'Alembert) that in age of progress, the role of the great genius is actually diminished in relation to that of the compiler, condenser, or popularizer: "No sensible preceptor would at this day recommend the study of Newton's Principia, or his treatise of Universal Arithmetic, to persons unacquainted with the rudiments of that kind of knowledge; but would rather put into their hands treatises composed by persons infinitely inferior to that great father of the true philosophy, but which are, notwithstanding, much better adapted to the use of learners. It is needless to inquire whether the few who make discovery or the many who extend the knowledge of those discoveries, are more useful I the world of science. The labours of both are necessary to the propagation of knowledge and an improved state of society."[85] Though Priestley would become known for great discoveries (oxygen, or as he called it, "dephlogisticated air," foremost among these), he often cast himself in the latter role.
In point of fact, Priestley as often characterized himself as a historian as a natural philosopher. Without history, Priestley wrote, the scientist is at a great disadvantage: he is "wanting the lights that have been struck out by others, and perpetually running the risk of losing his labour, and finding himself anticipated in the discoveries he makes."[86] Indeed, Priestley argues that works such as his own History of the Present State of Electricity, with Original Experiments (1767) and History of the Present State of Discoveries Relating to Vision, Light, and Colours (1772) were not only increasingly important but "absolutely necessary" to progress in the present state of science. Without condensations, there was simply too much to read. If this was true even for men of means such as Priestley, how much more must it be, he wrote, for the generality. Were histories "judiciously compiled, real discoveries would be much more numerous," Priestley wrote, "and were these, again, easily and expeditiously circulated, the progress of knowledge might be accelerated beyond what we can now conceive."[87]
The same hopeful picture could not easily be drawn for civil history, whatever the historians might write or do. (Priestley, whose own political views led him afoul of both official and popular opinion, would eventually know this intimately, and his letters on his persecution and flight to America speak eloquently about the problem.)[88] Though civil history offers both the drama of strong passions and the attraction of human sentiments, it constantly disappoints the expectation of progress. In civil history, Priestley writes, "We are presented, indeed, with the prospect of gradual improvement during the rise of great empires; but, as we read on, we are obliged to contemplate the disagreeable reverse."[89] For this reason, the Chart of History gives quite a different effect than the Chart of Biography. "They are rather melancholy reflections, which the view of such a chart of history as this is apt to excite in the minds of persons of feeling and humanity. What a number of revolutions are marked upon it! What a broken appearance, in particular, do the finest and most cultivated parts of the earth exhibit, as Greece, Italy, Persia, and Egypt! What torrents of human blood has the restless ambition of mortals shed, and in what complicated distress has the discontent of powerful individuals involved a great part of their species!"[90] In Priestley's second chart, the framing line of time functions as the graphic ground against which the image of human violence and stupidity appears as check, break, and reverse. As in biography, so in history: the chart figures even without the assistance of words.
As we have already seen, the notion of representing time in a graphically linear fashion was understood to be new in the eighteenth century, and during this period, it had both defenders and critics. The German writer, Friedrich Strass, for example, objected to Priestley's charts on the grounds that they tended to flatten the dramatic contours of history into an arid plane of temporal sequence. Strass responded to Priestley by creating his own Stream of Time (1804), a chart in which history is allowed to speed and to slow, to snake and well up, like a great river.[91]
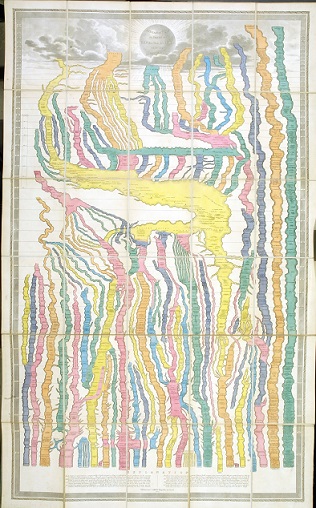
Figure 11: Friedrich Strass, Stream of Time, 1804
For the novelist, Laurence Sterne, the very idea of a linear historical narrative was a source of amusement. His great monument to digression, The Life and Opinions of Tristram Shandy (1760-67), put relentlessly in question the stability of linear narrative. As if responding directly to Priestley, Sterne ornamented his novel with looping and zigzagging images representing the kind of line that might describe his own manner of storytelling. And in the novel, he made the relationship between fictional and historical narrative explicit:
Could a historiographer drive on his history, as a muleteer drives on his mule, straight forward; for instance, from Rome all the way to Loretto, without ever once turning his head aside either to the right hand or to the left, he might venture to foretell you an hour when he should get to his journey's end. But the thing is, morally speaking, impossible. For if he is a man of the least spirit, he will have fifty deviations from a straight line to make with this or that party as he goes along, which he can no ways avoid. He will have views and prospects to himself perpetually soliciting his eye, which he can no more help standing still to look at than he can fly.[92]
On the surface of things, it would seem that Sterne and Priestley ended up on opposite sides of this theoretical scrum. Drawing on David Hartley's theory of association, Priestley notes that chronological narrative takes advantage of the "strongest associations" between experience and representation. Moreover, Priestley argues that the "mind is greatly disgusted with unusual, and consequently unexpected, and, to us, unnatural connexions of things."[93] But Priestley's use of Hartley turns out to be much friendlier to the linear skepticism of Sterne than it at first appears.
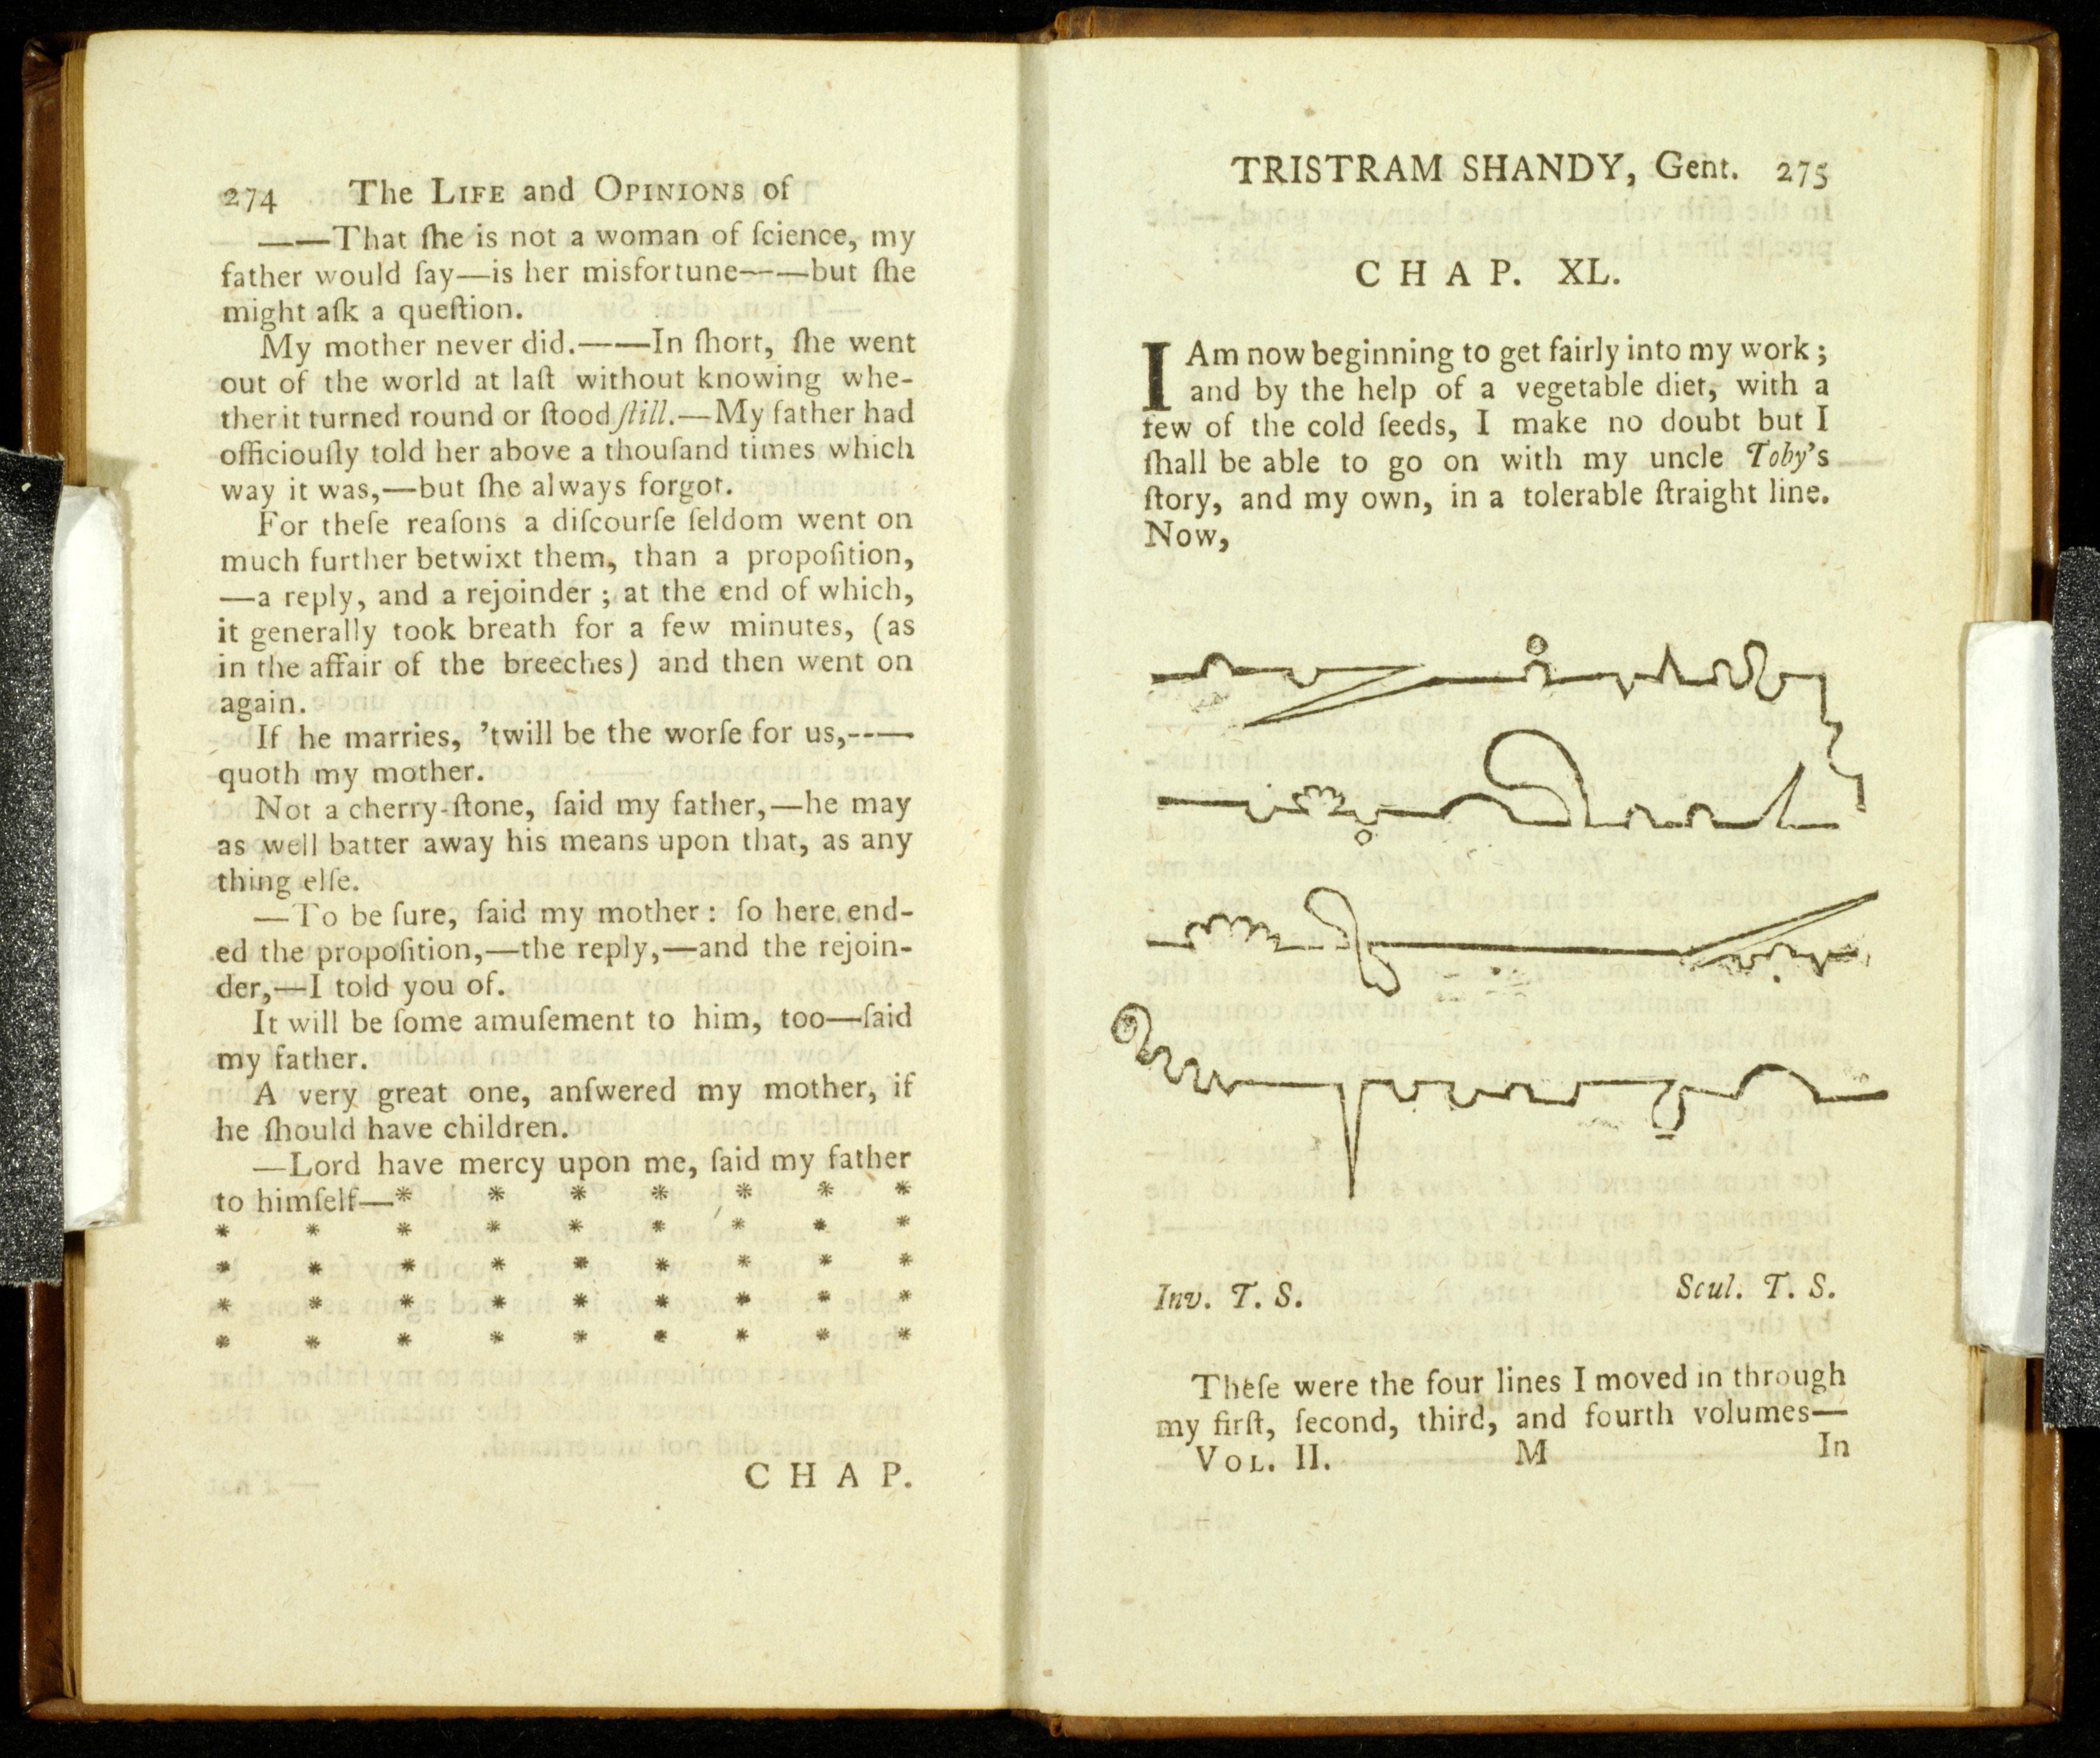
Figure 12: Laurence Sterne, Tristram Shandy, 1760-66
In fact, Priestley argues that the mind only admits chronology in fits. And argument, especially argument about cause and effect, becomes incoherent when tied too inflexibly to chronological sequence. The same interests that impel historians to employ the tools of chronology force them to set them aside just as often. Though cause naturally comes before effect, Priestley argues, this does not mean that it precedes it directly, or even closely, or that their relationship is simply one to one. Thus he says, "The relations of events to one another, by way of cause and effect, will sometimes unavoidably, and very justifiably, oblige an historian to trace an important event back to the causes that gave birth to it and again to pursue it through its distant consequences, far beyond the era in which it commenced."[94] Even the biographer, whose work is tied to a single life, will necessarily reach back to consider the effects of early experiences, passions, or education. Indeed, it is necessary for a biographer to occasionally skip from the beginning of a life to the end and back again in order to give purpose to the story. In such cases, Priestley argues, the strongest associations of ideas connect the most pertinent events or information, not the ones that follow each other immediately. And Priestley goes farther still: people, he says, "are not fond of pursuing any uniform track long without interruption; so that the natural connexions of ideas not quite foreign to the subject . . . may, in the hands of a judicious historian, give occasion to digressions from his principal subject, which shall greatly relieve the attention, please the imagination, refresh and assist the memory."[95] Of course, there is always a danger of digressing so far that the principal track of the narrative may be lost. But Priestley insists that digression is a natural and necessary part of understanding and of narrative itself. To use Priestley's own terms, there is a natural tension between the order of time and the unity of action in every representation of historical time.
As it turns out, in Priestley's view, the subject of history is only suited to uni-linear presentations under certain constraints, and while there is great value in linear organization, in the work of the best historians, Priestley argues, there is always a balance between linear and non-linear strategies. Among such historians, he points especially to Xenophon, Livy, Sallust, and Tacitus, all of whom achieved sophisticated narrative effects. None of these, Priestley notes, wrote in a way that particularly privileged the chronological. To the contrary, every one of them understood the importance of "looking backward or forward" and, if not to the same extent as Sterne, every one of them was a master of getting the story crooked.[96]
Ironically, according to Priestley linear chronologies are really the province of fiction, not of history. Priestley argued that because they are obliged to account for cause and effect, historians rarely allow themselves to think or write in actually linear terms. Fiction writers, by contrast, are free to follow the dictates of pleasure, including the pleasures of the line. They are "under no constraint from such a variety of considerations as the writers of true history must attend to, and which do not always leave them the masters of their own choice. If the matter or manner of a true historian do not please us, it may be the subject that is in fault; if a romance does not please us, we justly blame either the invention or judgment of the writer."[97] Neither Hogarth's "Line of Beauty" nor Blake's linear vortices were readily available to the historian.[98] History, written well, would inevitably be defined by the irregular network of discourse. In fact, among the great historians, Priestley finds only one, Thucydides, for whom chronology rules above all. Though no inestimable figure, as a writer, Thucydides nonetheless falls short. "Out of his extreme regard for truth," Priestley says, Thucydides "adhered too scrupulously to chronological order, so as frequently to pass, in a very abrupt and displeasing manner, from the midst of an important and interesting transaction, to a very trivial one."[99] Leaning on the authority of Adam Smith, Priestley suggests that the sophisticated reader must necessarily approach Thucydides out of order. As he proceeds through the work, he constantly turns over "leaves" (in fact or in his mind) to put causes with their proper effects. By this method, he keeps his attention "fixed" and "eager" without "disarranging the author's scheme."[100] According to Smith, the active and discriminating reader is ultimately responsible for his or her own textual effects. But the problem posed by the text of Thucydides, is only an exaggerated case of the problem faced in every act of reading.
It is important to be clear: Priestley in no way condemns the historiography of Thucydides. In fact, he mounts a strenuous defense. Priestley argues that in the era of Thucydides, there was as yet no good model for historical narrative. And so, even a great historian had no way of knowing the pitfalls of a strictly chronological presentation of events. Moreover, Thucydides had none of the technical advantages available to modern writers in order to maintain both order and unity in narrative. In particular, Priestley points to the footnote. "By the help of notes," Priestley writes, a history may go on without interruption, and yet a great variety of incidental things, worth recording, and which cannot be introduced with ease into the body of a work, may have a place assigned to them, where they may be attended at the reader's leisure."[101] Constrained to the textual line, Thucydides ended up introducing all sorts of distortions jumps from place to place, event to event, person to person into his narrative.
For Priestley, the best of all possible historical works are those that facilitate an active process of reading. Priestley points to a number of different kinds of notational systems and apparatuses that facilitate such engagements with the text; these include footnotes, marginalia, indexes, and charts and diagrams. He points, for example, to Pierre Bayle's monumental Dictionnaire historique et critique (1697), a work which overflowed with notes of all kinds. What Bayle began, Priestley says, other writers improved.[102] Priestley himself was deeply interested in the potential new views offered by representing a single body of knowledge under several different systems of organization such as was suggested by the Encyclop die of Diderot and d'Alembert. Among his own efforts along these lines is a remarkable alphabetical Index to the Bible.[103]
What of the timeline then? It would seem that Priestley's arguments about textual complexity would weigh against it after all, Thucydides gets a drubbing for a narrative rigidity that nowhere approaches the strictness of Priestley's graphic form. But in fact, the mechanism of the timeline is central to Priestley's project and to his historiographical critique. This is because, while linear in form, the timeline is not used in a linear fashion. Indeed, in the case of the Chart of Biography and the New Chart of History, it is difficult to imagine how exactly one might go about doing such a thing. As we have seen, both charts rely as much on effects of simultaneity as of sequence, and both are open to many readings. Both of these facts were essential to Priestley, and they formed the inspiration for his graphic work. Priestley was a fine and a prolific writer, and he wrote in many genres including history. But in the field of history, he always expressed frustration at the constraints of narrative. As we have seen, too, Priestley's own historical writing was nearly always either theoretical or thematic.
Priestley was both a progressive and a providential thinker: he believed that history had a direction, and it is undoubtedly the case that these convictions led him to reflect on the problem of time and lines. It is also clearly the case that the mechanism that he developed for representing chronologies in graphic form achieved its popularity in part because it lent itself so well to the figuration of progress. This would become particularly evident in its applications in the mid and late nineteenth century by Social Darwinists and others. But, for Priestley, the timeline was something else: it was a mechanism for breaking open historical narrative and for subjecting it to questions that it resisted in form. If the Chart of Biography in some way looked like progress, this was not true for the Chart of History, nor would it be for a hundred other charts plotted within the same epistemological space. For Priestley the creation of the timeline was a step toward reckoning with this multiplicity of possible ways of seeing and representing history. As Priestley suggests, the very possibility of a non-linear historiography requires first accounting for the line.
Inscription
"He who postpones the hour of living as he ought, is like the rustic who waits for the river to pass along (before he crosses); but it glides on and will glide forever." Horace, Epistles (I.2.41), quoted in Priestley, Description of a Chart of Biography, 24:476.
Acknowledgments
This article was written with the assistance of a Summer Stipend from the National Endowment for the Humanities. I presented earlier drafts at the 2005 meeting of the American Society for Eighteenth-Century Studies and at the Max-Planck-Institut für Wissenschaftsgeschichte. My deepest thanks to the librarians at Princeton University, the American Philosophical Society, and the Library Company of Philadelphia; the Early Modern Studies Group at the University of Oregon; Anthony Grafton, Mark Johnson, Sina Najafi, and Sasha Archibald.
Endnotes
[1] George Lakoff and Mark Johnson, Philosophy in the Flesh: The Embodied Mind and Its Challenge to Western Thought (New York: Basic Books, 1999), 155.
[2] W. J. T. Mitchell, "Spatial Form in Literature: Toward a General Theory," in W. J. T. Mitchell, ed., The Language of Images (Chicago: University of Chicago Press, 1980), 274.
[3] Mitchell, Spatial Form in Literature, 274.
[4] J. Hillis Miller, "Time in Literature," Daedalus (Spring 2003): 88.
[5] Eviatar Zerubavel, Time Maps: Collective Memory and the Social Shape of the Past (Chicago: University of Chicago, 2003); J. B. Priestley, Man and Time (Garden City, NY: Doubleday, 1964).
[6] Mary Bouquet, "Family Trees and their Affinities: The Visual Imperative of the Genealogical Diagram," Journal of the Royal Anthropological Institute 2:1 (1996); Robert J. O'Hara, "Trees of History in Systematics and Philology," Memorie della Società Italiana di Scienze Naturali e del Museo Civico di Storia Naturale di Milano, 27:1 (1996); "Systematic Generalization, Historical Fate and the Species Problem," Systematic Biology, 42:3 (1993); Carlo Ginzburg, "Family Resemblances and Family Trees: Two Cognitive Metaphors," Critical Inquiry 30:3 (Spring 2004).
[7] Thomas L. Hankins, "Blood, Dirt, and Nomograms: A Particular History of Graphs," Isis 90 (1999); James R. Beniger and Dorothy L. Robyn, "Quantitative Graphics in Statistics: A Brief History," The American Statistician 32:1 (1978); Laura Tilling, "Early Experimental Graphs," British Journal for the History of Science 8:30 (1975); Albert Biderman, "The Playfair Enigma," Information Design Journal 8:1 (1999).
[8] Joseph Priestley, A Chart of Biography (Warrington: 1765); Priestley, A New Chart of History (London: 1769); Priestley, Description of a Chart of Biography (Warrington: 1765); Priestley, Description of a New Chart of History (London: 1769). Except where noted, Priestley text citations are from John Towill Rutt, ed., The Theological and Miscellaneous Works of Joseph Priestley (London: G. Smallfield, 1817–32).
[9] James Playfair, A System of Chronology (Edinburgh: William Creech, 1784); William Blair, Tables Chronologiques, Pierre-Nicolas Chantreau, trans., (Paris, 1795); Pierre-Nicolas Chantreau, Science de l'histoire: contenant le systême général des connoissances a acquérir avant d'étudier l'histoire, et la méthode a suivre quand on se livre a ce genre d'étude, developpee par tableaux synoptiques (Paris: Goujon fils, 1803). Playfair's System juxtaposes political and biographical tables following Priestley's model (Playfair, System of Chronology, 274). Chantreau's work includes a variety of tables suggested by the Baconian tree in Diderot's Encyclopédie. "Nous croyons, sur la foi de l'expérience et d'après le témoignage des hommes les plus instruits, qu'enseigner l'Histoire n'est point commencer par telle ou telle Histoire, mais que c'est mettre celui à qui on l'enseigne en état de la lire; que c'est le notionner de manière que, dans les faits qu'on lui mettra par la suite sous les yeux, il soit capable de distinguer les rapports politiques et moraux que les hommes on entr'eux, et les conséquences de ces rapports. C'est seulement quand on est parvenu à ce point, qu'il convient d'ouvrir un livre d'histoire et d'en méditer le contenu" (Chantreau, Science de l'histoire, ii). The adaptation of this form of hierarchical branching to the representation of history is awkward and appears in few other works. At the end of the work, Chantreau includes a chart of biography that is explicitly in the debt of Priestley. Other works in the debt of Priestley include: Joseph Emerson Worcester, An Historical Atlas (Boston: Hilliard, Gray, Little and Wilkins, 1827); Chronology, or an Introduction and Index to Universal History, Biography, and Useful Knowledge (New York: Jonathan Leavitt, 1833); Francis A. Durivage, A Popular Cyclopedia of History (New York: Freeman, Hunt, et. al., 1835).
[10] The Library Company of Philadelpha, for example, holds an early edition of Priestley's Description of a Chart of Biography that was published without an accompanying supplementary chart. This copy of the book, owned by W. H. Barker, contains a chart hand-made by the owner according to Priestley's principle, but varying in its details. See image in text below. Joseph Priestley, Description of a Chart of Biography, 3rd edn. (London: J. Johnson, 1767).
[11] The Dickinson chart may be the work of Samuel Miller, a friend and associate, who, like Dickinson, had a keen interest in history and chronology. Miller's principal historical publication was A Brief Retrospect of the Eighteenth Century, in Two Volumes: Containing a Sketch of the Revolutions and Improvements in Science, Arts, and Literature during that Period (New York: T. and J. Swords, 1803).
[12] Howard Wainer, "Tom's Veggies and the American Way," Chance 10:3 (1997).
[13] Mortimer, Thomas. The Student's Pocket Dictionary; or, Compendium of Universal History, Chronology, and Biography from the Earliest Accounts to the Present Time. (London, 1777); John Adams, The Elements of Useful Knowledge: Comprehending, among Other Interesting Particulars, Short Systems of Astronomy, Mythology, Chronology, and Rhetoric; with a Brief Account of the Trial and Execution of Louis XVI (London: B. Law and Son, 1793); Erasmus Darwin, A Plan for the Conduct of Female Education, in Boarding Schools (Derby, 1797).
[14] H. Gray Funkhouser, "Historical Development of the Graphical Representation of Statistical Data," Osiris 3 (1937); Funkhouser and Helen M. Walker, "Playfair and His Charts," Economic History 3:10 (1935); Edward R. Tufte, The Visual Display of Quantitative Information, 2nd ed. (Cheshire, Conn.: Graphics Press, 2001); Albert Biderman, "The Playfair Enigma," Information Design Journal 6:1 (1993); Howard Wainer, "Why Playfair?" Chance 9:6 (1996); Wainer, "Who Was Playfair?" Chance 10:1 (1997); Wainer and Ian Spence, "William Playfair: A Daring Worthless Fellow," Chance 10:1 (1997); Patricia Costigan-Eaves, "Some Observations on the Design of William Playfair's Line Graphics," Information Design Journal 6:1 (1990); Costigan-Eaves and Michael Macdonald-Ross, "William Playfair (1759–1823)," Statistical Science 5:3 (1990); Erica Royston, "Studies in the History of Probability and Statistics III: A Note on the History of the Graphical Presentation of Data," Biometrika 43:3/4 (1956).
[15] William Playfair, The Commercial and Political Atlas, Representing, by Means of Stained Copper-Plate Charts, the Exports, Imports, and General Trade of England: The National Debt, and Other Public Accounts (London: J. Debrett, 1786); Playfair, An Inquiry into the Permanent Causes of the Decline and Fall of Powerful and Wealthy Nations (London: W. Marchant, 1805).
[16] "Joseph Priestley of Warrington, Doctor of laws, Author of a chart of Biography & Several other valuable works, a gentleman of great Merit & learning, & very well versed in Mathematical & philosophical Enquiries, being desirous of offering himself as a candidate for election into this Society, is recomended by us on our personal knowledge, as highly deserving that honour; & we believe that he will, if elected, be a usefull and valuable Member. 1. 13 March 1766 James Burrow, W. Watson, 2. 20 March Cha: Morton, 3. 10 April B. Franklin, 4. 17 April John Canton, 5. 24 April, Sam Chandler, 6. 1 May, 7. 8 May Richd Price, 8. 15 May, 9. 29 May, 10. 5th June, Ballotted for & Elected 12 June 1766, paid 25 Guineas." Priestley's Royal Society Certificate, first dated 13 March 1766, elected 12 June 1766; Archives, Royal Society of London (EC/1766/12). See also, A Scientific Autobiography of Joseph Priestley, 1733–1804, ed. Robert E. Schofield (Cambridge, Mass.: M.I.T. Press, 1966), 20, 49; John Wheeldon. A Sermon Preached at Huntingdon Assizes, July 26, 1773 (Cambridge, 1773).
[17] During the sixteenth and seventeenth centuries, this diversity of chronological and chronographic sources became a subject of great scholarly concern. The greatest of the early modern comparative chronologists was Joseph Scaliger. On Scaliger and his contemporaries, see esp., Anthony Grafton, Joseph Scaliger: A Study in the History of Classical Scholarship (Oxford: Clarendon, 1983).
[18] For a modern example, see Harry Elmer Barnes, A History of Historical Writing. 2nd ed. (New York: Dover, 1963). For an eighteenth-century example, see Nicolas Lenglet du Fresnoy, Chronological Tables of History (London, 1762).
[19] Hayden White, "The Value of Narrativity in the Representation of Reality," in The Content of the Form: Narrative Discourse and Historical Representation (Baltimore: John Hopkins University Press, 1987), 4–5.
[20] White, Value of Narrativity, 8.
[21] Joseph Priestley, Autobiography of Joseph Priestley: Memoirs Written by Himself; and, An Account of Further Discoveries in Air (Bath: Adams & Dart, 1970); Robert E. Schofield, The Enlightenment of Joseph Priestley: A Study of His Life and Work from 1733 to 1773 (University Park, Pa.: Pennsylvania State University Press, 1997); Schofield, The Enlightened Joseph Priestley: A Study of His Life and Work from 1773 to 1804 (University Park, Pa.: Pennsylvania State University Press, 2004); John Towill Rutt, Life and Correspondence of Joseph Priestley (London: R. Hunter, 1831).
[22] Priestley, Description of a Chart of Biography, 24:467.
[23] Priestley, Description of a Chart of Biography, 24:470.
[24] Priestley, Description of a Chart of Biography, 24:468.
[25] Priestley, Description of a Chart of Biography, 24:470. In the New Chart of History, too, dots function to indicate uncertainty: "if an horizontal line consist of dots only, it expresses that the boundaries between the two contiguous empires were not known, or very variable; as that between the Romans and Persians. If the dotted line be a vertical one, it expresses the uncertainty of a date as the time when the Japanese lost the possession of Korea. I have also distinguished conquests, and forcible changes of empire from peaceable revolutions, as those occasioned by marriages, voluntary cession, &c., making a full line to express the former, and not a dotted, but a broken line, to express the latter. . . . In some cases, I have thought it worth while to express the dependent state of a people by horizontal broken lines, as that of the Jews after their return from the Babylonish captivity, till they asserted their independency under the Maccabees." Priestley, Description of a New Chart of History, 24:479. On Newton's system of chronology, see Priestley, Lectures on History, 24:84–91.
[26] Priestley, Lectures on History, 24:134. According to Priestley, the direct inspiration for the New Chart of History was a French chart translated into English in 1753, which Priestley criticizes in many details. Though Priestley gives no bibliographic details, this is certainly the Chart of Universal History (London: Thos. Jeffreys, 1753) held by the British Library. Among other differences, Priestley notes that his own chart is oriented horizontally rather than vertically. This, he believed to be easier to understand, and after Priestley, a great number of charts take this horizontal orientation. A notable exception is Adam Ferguson's fine chart of history in the 1797 edition of the Encyclopaedia Britannica.
[27] Priestley, Lectures on History, 24:136. "I have given the purchasers of this chart an equal opportunity of shewing their own particular attachments: for, excepting a few crowded places, I have left room enough in the chart to supply my omissions, by inserting whatever names they please. Besides, lines may be drawn in any place, even where names cannot be inserted; and as the person who inserts them will know what lives they represent, the names are quite superfluous. And there will always be increasing room to insert those who die after the publication of the chart, at lest till the year 1800; a date which none who are now capable of perusing this chart can reasonably expect to see." (Priestley, Description of a Chart of Biography, 24:472) Priestley's confidence on this last point proved unwarranted. He himself lived to 1804, and new editions of his charts were produced all the way through 1820. This is particularly ironic given the centrality of Newton's observation about the regularity of generations to Priestley conception.
[28] Priestley, Lectures on History, 24:133.
[29] Priestley, Description of a New Chart of History, 24:478, 480.
[30] Priestley, Description of a New Chart of History, 24:481. Priestley's chart is highly uniform in its presentation. The major exceptions to this are the title of the chart, its "explanation," and the dedication to Benjamin Franklin. These occur in parts of the chart that are otherwise blank. Though they are inscribed in a different referential register than the rest of the chart, visually, they function to balance the work as a whole and to emphasize its unity. In fact, the blank parts of the chart pose a conceptual problem, of which Priestley is very much aware: as a chart of history, this is not, strictly speaking, a chart of time. For Priestley and his contemporaries, there was time without history, and the chart makes very clear how such time was defined. History, in this chart, follows after empire. It begins earliest in Egypt and in Mesopotamia, and it begins latest in the Americas. In South and Central America, history does not begin in 1492, but rather at the more or less certain origins of the Inca, Maya, and Aztec empires. In North America, however, where no indigenous imperial structures were known to Priestley, history prior to contact with Europe is simply blank. Priestley's use of the space of America for the title of his chart tends to distract from rather than to highlight this difference, while his dedication to Franklin shores up the visual gap left by the relatively short history of the Britons.
[31] Priestley, Lectures on History, 24:133.
[32] Priestley, Lectures on History, 24:30
[33] Priestley, Description of a Chart of Biography, 24:476.
[34] Priestley, Description of a Chart of Biography, 24:475–6.
[35] On Priestley's theories of progress and millennium, see especially, Jack Fruchtman, "Politics and the Apocalypse: The Republic and the Millennium in Late-Eighteenth-Century English Political Thought," in Harry Payne, ed., Studies in Eighteenth-Century Culture (Madison: University of Wisconsin Press, 1981); Fruchtman, "The Apocalyptic Politics of Richard Price and Joseph Priestley: A Study in Late Eighteenth Century English Republican Millennialism," Transactions of the American Philosophical Society 73 (Philadelphia: American Philosophical Society, 1983); Fruchtman, "Joseph Priestley and Early English Zionism," Enlightenment and Dissent 2 (1983); Clarke Garrett, "Joseph Priestley, the Millennium, and the French Revolution," Journal of the History of Ideas 34:1 (1973).
[36] Priestley, Description of a Chart of Biography, 24:475.
[37] Priestley, Description of a Chart of Biography, 24:475.
[38] Erasmus Darwin, A Plan for the Conduct of Female Education, in Boarding Schools (Derby, 1797), 23, 121; R. Steele, "A Gentleman's Library," The Cambridge Magazine: or, Universal Repository of Arts, Sciences, and the Belles Letters (London, 1769), 368; Hester Chapone, Letters on the Improvement of the Mind, Addressed to a Young Lady (London, 1786), 207; Maria Edgeworth and Richard Lovell Edgeworth, Practical Education (London, 1798), 2:419. The authors of Practical Education recommend keeping the Chart of Biography scrolled up in a convenient spot. Whenever a student's curiosity is piqued by the mention of a particular historical figure, the teacher is instructed to unfurl the chart in order to discover when he lived (the masculine pronoun is appropriate here) and with whom he may have had commerce.
[39] Priestley believed that no great intellectual achievement had ever been possible without others before it. Similarly, he believed, that the great made possible the ordinary. "Thus when the great Columbus had discovered the New World, any person acquainted with the common principles of navigation could give directions for sailing to it; and succeeding voyages were made with much less difficulty and hazard than the first. The same is true of the Newtonian philosophy. No sensible preceptor would at this day recommend the study of Newton's Principia, or his treatise of Universal Arithmetic, to persons unacquainted with the rudiments of that kind of knowledge. They would rather put into their hands treatises composed by persons infinitely inferior to that great father of the true philosophy, and which are, notwithstanding, much better adapted to the use of learners." Priestley, Description of a Chart of Biography, 24:264.
[40] Priestley, Description of a Chart of Biography, 24:475.
[41] Priestley, Description of a Chart of Biography, 24:464. See also, Joseph Priestley, The History and Present State of Discoveries relating to Vision, Light, and Colours (London: J. Johnson, 1772). This work contains a fold-out "Biographical Chart of those who have most distinguished themselves by their Discoveries relating to Vision, Light, and Colours" beginning with the Arabic mathematician, Alhazen, in the eleventh century and culminating in a crowd of scientists around the time of Newton.
[42] Priestley, Description of a Chart of Biography, 24:467.
[43] Priestley, Description of a Chart of Biography, 24:467.
[44] Francis Tallents, A View of Universal History from the Creation, to the Destruction of Jerusalem by Adrian, in the Year of the World 4084, and of Christ 135 (London: Littlebury, 1685); Christoph Helwig, Historical and Chronological Theatre (London: M. Flesher, 1687).
[45] Priestley, Lectures on History, 24:108–9.
[46] Priestley, Lectures on History, 24:108–9.
[47] "All that can be necessary for chronologers to speak the same language, and be perfectly understood by one another and by all mankind, is to give every year the same name or designation, which is most conveniently done by expressing them in a series of numbers in arithmetical progression, any one term of which they shall agree to affix to the same year, a year in which any well-known event happened. . . . That Christ might not have been born in the first of that system of years to which it serves to give a name, is no inconvenience whatever; since, whatever differences of opinion there may be among chronologers about the time when Christ was born, they all agree in calling the present year, and consequently every other year, by the same name, and therefore they have the same idea of the interval between the present year and any other year in the system. The real time of Christ's birth can no more affect the proper use of this system than that of any other indifferent event; since, using the same system of dates, they may say, Christ was born in the third, fourth, fifth, sixth, or, what I think to be the case, in the seventh year before the Christian era. . . .Whenever, therefore, chronologers ceased to date events from the creation, which was very absurd (since they did not agree in fixing the interval between the present year and the date of that event, and therefore gave all the years different names), they had no occasion to have recourse to any such period as the Julian; since another, capable of answering the same purposes, was already in common use, supplying them with a language which they all equally understood." Joseph Priestley, An Essay on a Course of Liberal Education for Civil and Active Life (1765), 24:109.
[48] Priestley, Lectures on History, 24:129.
[49] Priestley, Lectures on History, 24:129.
[50] Priestley, Lectures on History, 24:131.
[51] Priestley, Lectures on History, 24:130.
[52] Grafton, Joseph Scaliger; James Barr, "Pre-Scientific Chronology: The Bible and the Origin of the World," Proceedings of the American Philosophical Society 143:3 (1999); Kenneth Jacob Knoespel, "Newton in the School of Time: The Chronology of Ancient Kingdoms Amended and the Crisis of Seventeenth-Century Historiography," The Eighteenth Century 30:3 (1989); Alden A. Mosshammer, The Chronicle of Eusebius and Greek Chronographic Tradition (Lewisburg, Pa.: Bucknell University Press, 1979); William Adler, Time Immemorial: Archaic History and Its Sources in Christian Chronography from Julius Africanus to George Syncellus (Washington, D.C.: Dumbarton Oaks, 1989).
[53]Isaac Newton, The Chronology of Antient Kingdoms, Amended (London: J. Tonson, 1728).
[54] Joseph Scaliger, Thesaurus temporum (Leyden, 1606).
[55] Lloyd's edition is, The Holy Bible, containing the Old Testament and the New (London: C. Bill, 1701). In fact, Thomas Guy, and two other enterprising booksellers, had already done something similar by 1679 and possibly as early as 1675. The Holy Bible: containing the Old Testament and the New: newly translated out of the originall tongues and with the former translations diligently compared & revised (Oxford: T. Guy, et. al., London, 1679).
[56] In certain places this creates a strange effect, particularly in the Gospels where, with each complementary account, time is set back once again. This problem was central to Eusebius, and it was the catalyst for an entire tradition of Biblical interpretation. Like Priestley, Eusebius believed that such difficulties could be addressed through visual means. He synchronized the Gospels by using a canon table, a chart which allowed him to align each the passages from the different Gospels that referred to the same event. Eusebius was also instrumental to the foundation of the tradition of chronography perpetuated by Helvicus and his contemporaries, and indeed, many such works are explicitly framed as commentaries upon Eusebius. As Anthony Grafton has argued, the basic tabular format established by Eusebius had great lasting power, and it formed a foundation of Scaliger's and many other early modern chronological projects.
[57] White, Value of Narrativity, 9.
[58] John Blair, The chronology and history of the world, from the creation to the year of Christ, 1753 (London: 1754), preface.
[59] Blair, Chronology and History of the World, preface.
[60] Blair, Chronology and History of the World, preface.
[61] Willi Apel, The Notation of Polyphonic Music, 900–1600 (Cambridge, MA: Medieval Academy of America, 1953), 188–200.
[62] Blair, Chronology and History of the World, preface. It is interesting to note that the very last entry on this chronology is the calendrical change instituted in England in 1753: "The New Stile introduced into Great Britain ye 3d of Septr. being counted the 14th." Though coincidental, the timing of the date change solved a potentially annoying problem in Blair's system. Blair also proposes several improvements relative to the work of Helvicus. He adds eras where necessary; includes a separate column for statesmen and warriors; adds dates of death and ages at death for great men of learning; and includes new columns as needed, as for example, at the end of the Middle Ages, when the new kingdoms of the modern world all of a sudden "erupt"; he adds an index to "awaken the curiosity" to the "many strong and remarkable Connections" among events separated in time. Above all, Blair notes one difference in the greater shape of his work and that of Helvicus: the tables of Helvicus are typeset, his own are engraved. This, he says, enables him to "render the Whole more distinct and useful, than could have been done, by common Printing because the Fifty faint Hair Lines, which run across every Plate, contain each of them an united View, of the State of the World, for one Year; and lead the Eye, by a plain and clear Direction, from any particular Event, to the Year of the Reign of the different Kings. . . ." The look of the cursive engraving in Blair is quite distinctive: it is reminiscent of manuscript chronicles in which entries are placed as if on lines in a ledger; Blair's aim is decidedly chronological.
[63] In the anonymous French chart which Priestley used as an inspiration, historical time proceeds in leaps of 500 years beginning after the Flood. After a period, it shifts to units of 250 years, then 200, then finally 100.
[64] Paolo Rossi, The Dark Abyss of Time: The History of the Earth and the History of Nations from Hooke to Vico, trans. by Lydia Cochrane (Chicago: University of Chicago Press, 1984); Stephen Toulmin and June Goodfield, The Discovery of Time (New York: Harper & Row, 1965).
[65] Priestley even developed a calculus of historical certainty derived from David Hartley's Observations on Man: "putting 1/a for the absolute value of each dependent evidence, or the insufficiency of each independent evidence, absolute certainty in the former case, and absolute uncertainty in the latter, being equal to unity, and making the number of witnesses the power of n in both. From this it will be manifest upon a little attention, that provided the power (n) be considerable, (a) may be very little without greatly diminishing the value of the expression; what is, without greatly lessening the probability in the one case, or the improbability in the other. For example, let a=3 and n=10; then a 1/n = 1/30,000,000,000 which, in independent evidence, will be little less than absolute certainty; and in dependent evidence, little less than absolute uncertainty." Priestley, Lectures on History, 24:57–8.
[66] Jacques Barbeu-Dubourg, Chronographie universelle & détails qui en dépendent pour la chronologie & les généalogies (Paris: Barbeu-Dubourg, Lamote, Fleury, 1753); Barbeu-Dubourg, Chronographie, ou, Description des tems: contenant toute la suite des souverains de l’univers & des principaux événemens de chaque siécle depuis la création du monde jusqu’à présent; en trente-cinq planches gravées en taille-douce & réunies en une machine d’un usage facile & commode (Paris: Barbeu-Dubourg, Lamote, Fleury, 1753). Later, Barbeu-Dubourg received a copy of Priestley's biographical chart from their mutual friend Benjamin Franklin (to whom Priestley's 1769 New Chart of History would be inscribed). In a letter to Franklin, Barbeu-Dubourg affirms the originality of Priestley's work. Correspondence of Benjamin Franklin 15:112a (5/8/1768). For a complete account of the Chronographie, see Stephen Ferguson, "The 1753 Carte Chronographique of Jacques Barbeu-Dubourg," Princeton Library Journal 52:2 (1991), 190–230.
[67] Diderot was interested by the idea of Barbeu-Dubourg's invention and devoted an entry in the 1777 Geneva quarto edition of the Encyclopédie to "Chronologique (machine)." Ferguson, Carte Chronographique, 203.
[68] Priestley was not averse to contemplating a chronology of creation, and in the Description of a Chart of Biography he offers a sketch of how such a chronology might look in his scheme. However, he carefully separated this project from his principal chronographic presentation in order to preserve the regularity of each. This creation chronography juxtaposes alternative reckonings, one "according to the Hebrew chronology," the other "according to the Septuagint." Priestley, Description of a Chart of Biography (London: 1765), 33.
[69] Priestley, Description of a Chart of Biography, 24:474.
[70] Joseph Priestley, A Description of a System of Biography: With a Catalogue of All the Names Inserted in It, and the Dates Annexed to Them (Philadelphia: Matthew Carey, 1803), 3; Joseph Priestley, Letter to John Vaughn (17 November 1803), American Philosophical Society, Misc Ms. Coll.
[71] Priestley, Description of a System of Biography, ms. insert. American Philosophical Society, copy a.
[72] Priestley, Description of a Chart of Biography, 24:465.
[73] Priestley, Description of a Chart of Biography, 24:465
[74] Priestley, Description of a Chart of Biography, 24:465
[75] Priestley, Description of a Chart of Biography, 24: 465–6.
[76] Priestley, Description of a Chart of Biography, 24:467
[77] Priestley, Description of a Chart of Biography, 24:466–7.
[78] Priestley, Description of a New Chart of History, 24:478
[79] Priestley, Description of a New Chart of History, 24:480. Nicolas Lenglet du Fresnoy, concerned about the massive amounts of information available to a historian, counseled against overly extensive reading. He instructed his reader to read fewer books more thoroughly. A modern reader might be taken aback by his notion of an abbreviated syllabus of history. With application, he suggested that his reading list might be mastered in as little as ten years, six months. Nicolas Lenglet Dufresnoy, Chronological Tables of Universal History (London, 1762).
[80] Joseph Priestley, History of the Present State of Electricity, with Original Experiments (1767), 25:344.
[81] Priestley, History of the Present State of Electricity, 25:341–2. When we contemplate any actual progress in times past, he writes, "we cannot help forming an idea of an unlimited increase in futurity; which is a prospect really boundless, and sublime." This sentiment contrasts directly with that aroused by the contemplation of civil history. Whereas the idea of progress naturally reinforces our confidence in divine providence, the idea of divine providence serves as a necessary corrective to the dark ideas that a broad vision of civil history must inspire. Priestley writes, "if a man have any sentiment of virtue and benevolence, he cannot help being shocked with a view of the vices and miseries of mankind, which, though they be not all, are certainly the most glaring and striking objects in the history of human affairs. An attention, indeed, to the conduct of divine Providence, which is ever bringing good out of evil, and gradually conducting things to a more perfect and glorious state, tends to throw a more agreeable light on the more gloomy parts of history; but it requires great strength of mind to comprehend those views; and, after all, the feelings of the heart too often overpower the conclusions of the head" (Priestley, History of the Present State of Electricity, 25:342). See also, Priestley, Description of a New Chart of History, 24:484: "As believers in divine revelation, we have reason to think, that it will not be long before this world assumes another and more agreeable aspect."
[82] Priestley, History of the Present State of Electricity, 25:344.
[83] Priestley, Description of a Chart of Biography, 24:463.
[84] Priestley, History of the Present State of Electricity, 25:349.
[85] Priestley, Description of a Chart of Biography, 24:464.
[86] Joseph Priestley, History of the Present State of Discoveries Relating to Vision, Light, and Colours (1772), 25:362.
[87] Priestley, History of Vision, Light, and Colours, 25:362.
[88] Jenny Graham, Revolutionary in Exile: The Emigration of Joseph Priestley to America, 1794–1804 (Philadelphia: American Philosophical Society, 1995).
[89] Priestley, History of the Present State of Electricity, 25:344.
[90] Priestley, Description of a New Chart of History, 24:483
[91] Friedrich Strass, Der Strom der Zeiten, oder, Bildliche Darstellung der Weltgeschichte: von den ältesten Zeiten bis zum Ende des achtzehnten Jahrhunderts (Vienna: Anton Doll, 1804); Strass, Ueberblick der Weltgeschichte: zur Erläuterung der bildlichen Darstellung derselben (Vienna: Anton Doll, 1804). Strass puts it as follows: "However natural it may be to assist the perceptive faculty, in its assumption of abstract time, by the idea of a line, and however inseparable the sensible and mental objects may have become by the figurative method of speech; it is astonishing that upon this near advance, and with similar assistance from the delicate preciseness of language, the image of a Stream should not have presented itself to any one, whose consideration had been attracted to this object. The expressions of gliding, and rolling on; or of the rapid current, applied to time, are equally familiar to us wit those of long and short. Neither does it require any great discernment to trace, as a farther exemplification of this assertion, in the rise and fall of empire, an allusion to the source of a river, and to the increasing rapidity of its current, in proportion with the declivity of their channels towards the engulphing ocean. Nay, this metaphor, by presenting something more congenial to a common object of sense, and at the same time more agreeable in its variations on the nature of the abstract notion, gives greater liveliness to the ideas, and impresses events more forcibly upon the mind, than the stiff regularity of the straight line. Its diversified power likewise of separating the various currents into subordinate branches, or of uniting them into one vast ocean of power; of dispersing them a second time, but still in such a manner that they are always ready under the guidance of some great conqueror to converge again into one point, tends to render the idea by its beauty more attractive, by its simplicity more perspicuous, and by its resemblance more consistent. William Bell, Descriptive guide to The stream of time, or, General outline of universal history, chronology, and biography, at one view (Hull: Joseph Simmons, 1812).
[92] Laurence Sterne, Life and Opinions of Tristram Shandy, Gentleman (New York: Norton, 1980), 346–7.
[93] Priestley, Lectures on Oratory, 24:281.
[94] Priestley, Lectures on Oratory, 24:281.
[95] Priestley, Lectures on Oratory, 24:281.
[96] Hans Kellner, Language and Historical Representation: Getting the Story Crooked (Madison: University of Wisconsin Press, 1989).
[97] Priestley, Lectures on Oratory, 24:282.
[98] W. J. T. Mitchell, "Metamorphoses of the Vortex: Hogarth, Turner, and Blake," in Richard Wendorf, ed., Articulate Images: The Sister Arts from Hogarth to Tennyson (Minneapolis: University of Minnesota Press, 1983).
[99] Priestley, Lectures on Oratory, 24:282–3. In his History of the Present State of Discoveries Relating to Vision, Light, and Colours, Priestley emphasizes that his own historiography takes a more associative route: "I have adopted the historical method, because it appears to me to have many obvious advantages over any other for my purpose, being peculiarly calculated to engage the attention, and to communicate knowledge with the greatest ease, certainty, and pleasure. . . . It will, however, be found, that though the method I have chosen be historical, it is at the same time sufficiently systematical . . . so that any person. . . may see without interruption all the discoveries that have been made relating to any single head or division of every subject. . . . I have imitated the conduct of the best civil historians, in making the order of time give place . . . to more natural, and therefore more important connexions. . . . This method cannot but be more agreeable to all my readers than a mere journal, or a strictly chronological narrative of transactions." Priestley, History of Vision, Light, and Colours, 25:365.
[100] Priestley, Lectures on Oratory, 24:285.
[101] Priestley, Lectures on Oratory, 24:285.
[102] Priestley, Lectures on Oratory, 24:285. In the case of Bayle, Priestley writes, the main text appears almost an excuse for the notes which "could not have been incorporated into any regular work or have been published conveniently in any other form." What Bayle did "by necessity," Priestley says, more recent writers have done by choice. A striking similar statement is made by Denis Diderot and Jean le Rond d'Alembert in their defense of the Encyclopédie, a work that explicitly eschews the linear and hierarchical structures of previous encyclopedias. Diderot and d'Alembert preferred cross references to footnotes, but the force of their argument is very similar; moreover, the language employed by Priestley is so close as to suggest an implicit reference to Diderot and d'Alembert. On this see, Daniel Rosenberg, "An Eighteenth-Century Time Machine: The Encyclopédie of Diderot," in Daniel Gordon, ed. Postmodernism and the Enlightenment: New Perspectives in Eighteenth-Century French Intellectual History (New York: Routledge, 2001).
[103] Priestley, Index to the Bible, 25:196. Here, Priestley sounds themes familiar from his charts of history and biography. The alphabetical index is an aid to memory, a way to speed intellectual work, and a device to make available information that might otherwise be trapped. It is notable too that Priestley invokes the example of Eusebius, the single most important writer in the chronographic tradition leading up to Priestley: "The work which I now present to the public is one of the most laborious that I ever undertook, but it has been far from being irksome; and I shall think my labour abundantly compensated if it be found to be useful. To myself such a work would have been exceedingly so if I had been possessed of it in the early part of my life; and it must be so to all persons who are conversant in the Scriptures, and who wish to find any thing contained in them without any unnecessary loss of time. A few persons there are (and with one of them I was well acquainted, and who I believe is now living) who perfectly remember every word in the Bible, and who, if any passage in it be read to them, will tell the chapter and verse in which it is to be found; or, if the chapter and verse be named, will recite the passage. Eusebius also, I think, speaks of an excellent reader in a Christian church in his time who was blind. But the generality of those who are the best acquainted with the Scriptures, have by no means so perfect a recollection of what they read. . . . To provide such persons with the assistance they want, an Alphabetical Index is necessary. . . ."