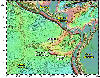
 | A regional view of the Galapagos Archipelago. The submerged Carnegie and Cocos Ridges and the Galapagos Platform are a light red color. The Galapagos Islands sit atop the Galapagos Platform and are colored light blue. Bathymetric and topographic data compiled by: Smith, W. H. F. and D. T. Sandwell, Global Seafloor Topography from Satellite Altimetry and Ship Depth Soundings, Science, v. 277, p. 1956-1962, 26 September, 1997. | 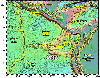 | A regional view of the Galapagos Archipelago, including boundaries of the adjacent tectonic plates. Bathymetric and topographic data compiled by: Smith, W. H. F. and D. T. Sandwell, Global Seafloor Topography from Satellite Altimetry and Ship Depth Soundings, Science, v. 277, p. 1956-1962, 26 September, 1997. | 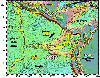 | The direction of the migrating tectonic plates is annotated by the black arrows. Bathymetric and topographic data compiled by: Smith, W. H. F. and D. T. Sandwell, Global Seafloor Topography from Satellite Altimetry and Ship Depth Soundings, Science, v. 277, p. 1956-1962, 26 September, 1997. | 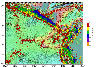 | Bathymetric and topographic data compiled by: Smith, W. H. F. and D. T. Sandwell, Global Seafloor Topography from Satellite Altimetry and Ship Depth Soundings, Science, v. 277, p. 1956-1962, 26 September, 1997. Earthquake (PDE) data retrieved from: http://www.neic.cr.usgs.gov/neis/epic/epic_global.html |
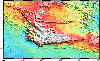 | The Galapagos Islands sit atop of the Galapagos Platform, highlighted by the color white. Bathymetric data compiled by William Chadwick, Oregon State University. | 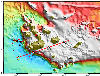 | A local view of the Galapagos Archipelago. The white squares and triangles are land seismometers used to record seismic waves from earthquakes. The white diamonds are seismometers that were placed on the ocean floor to record human induced seismic waves (see next page), used to map the crust and mantle. The red refraction line and yellow numbers correspond to the cross-section on the next page. The red circles are earthquake epicenters and the yellow star marks the epicenter of a larger earthquake. Bathymetric data compiled by William Chadwick, Oregon State University. | 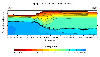 | This is a cross-section of the Galapagos Refraction Line, noted by the red reference line in the previous map. The numbers 1, 3, 5, and 7 correspond to the numbers on the previous map. |
|