|
CHARSTER |
|
|
|
Analysis of peak magnitudes
This procedure examines whether two counts may potentially be derived from the same Poisson distribution. It examines each identified peak and plots results of each test in a graphic window. Peaks (fire episodes) must be identified for the procedure to run. The following steps are taken:
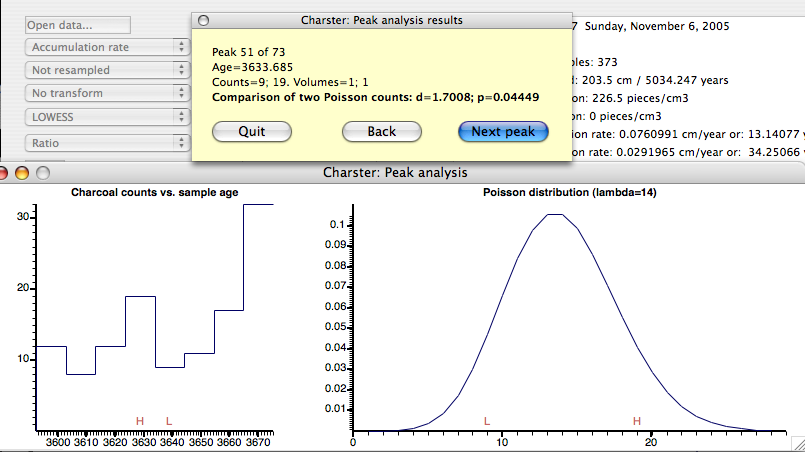
 This figure shows the output of peak magnitude analysis. The upper yellow window shows the current peak being analyzed, the charcoal counts and volumes of the sample, and the test for whether the two counts are significantly different. In this case, there is a 4.5% chance the two samples have the same mean concentration. The lower window shows two graphics: the left graphic is an enlargement of the charcoal record but showing counts on the y-axis, not concentration or accumulation rate. The H and L refer to the "post-fire" and "pre-fire" samples, respectively, that are being compared. A minimum of three samples to the left and right of the H and L samples are plotted. The right graphic shows a Poisson distribution with a mean (lambda) equal to the average of the charcoal counts in the low and high concentration samples. There is no current way to remove individual peaks from the list of computed peaks. It is recommended that either parameters are chosen that result in no peaks of marginal magnitude, or that such peaks are manually removed from the outputed data. If you wish to remove individual peaks, Charster will not be able to calculate the smoothed peak frequencies. However, it is possible to compute the smoothed peak frequencies from a list of peak dates using the program K1D. updated 21 June 2006 |