|
Next page
|
|

The main window contains controls for all of the analyses in the program. The left side of the window shows the steps of the analyses that are computed in order (from top down). When an option is changed, pressing "recalculate" will compute the analysis with the new options. Basic statistics on the analysis are presented in the 'console' on the right side of the window.
Most questions may be answered while on the main application window, by 'mousing over' the feature in question: help text appears near the bottom of the main window.
Outline of steps in Charster: (links go to appropriate help page)
- Read data.
- Read raw tab-delimited text file or a file created by Charster.
- Charster can be used to store detailed metadata about a site. This software is useful for archiving and sharing data.
- Examine initial plot of the record.

Initial chart produced by Charster. The x-axis is age, the y-axis is charcoal accumulation rate. The red bars below the x axis are areas with missing data. Click to enlarge.
- Initial data transforms and peak identification.
- Select series. Select whether the series to be analyzed is concentration data or accumulation rate data.
- Resample data. The raw data may be interpolated to a constant time interval.
- Transform data. The data may be transformed using log (base 10) or an exponent.
- Select background. The slowly-varying component of a charcoal record may be estimated using one of six methods.
- Select type of peak component. The peak component may be defined as a difference (residual, or series-background), or a ratio (series/background).
- Select a threshold for detecting peaks. When the peak component moves from below to above this threshold, a peak is defined.

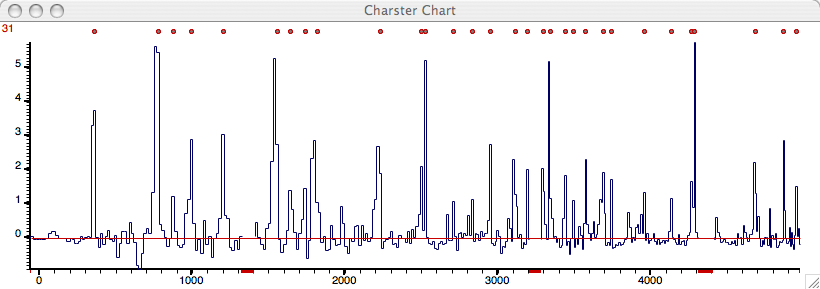
Chart showing the peak component and the peak locations as dots at the top of the figure. The red number to the left is the total number of peaks. The x-axis is age, the y-axis is the peak component. The red bars below the x axis are areas with missing data. Click to enlarge.
- Select a window width for smoothing peak frequency. This calculates a smoothed, running mean of number of fire episodes within a window of the specified width.
- After calculations are made, the results may be exported by choosing Export Data... in the File menu. This saves a tabbed-delimited text file with columns corresponding to calculated fields.
- The contents of the box on the right (the "console") contains basic statistics of each record analyzed, and the parameters used for peak identification of each data file that was exported. This text may be saved to a text file at any time (under File menu).
- Analyses of the peak component.
- Analyze peak magnitudes. This option is available after peaks (fire episodes) have been identified. It enlarges a graphic of each peak, but plots number of pieces counted as a function of time. It provides statistics on whether the peak contains significantly more charcoal than the period before it.
- Analyze frequency distribution of the peak component. The series must be resampled to constant time intervals. This option plots a frequency distribution of the peak component. One may also fit two types of distributions to the peak component to characterize the main form of variation in the distribution.
updated 21 June 2006
|